Goats on our roads

Goats on our roads


Seems the latest food fashion in Australian politics is Goat a la scāpé. And it’s being served at both parties.

Politicians are spruiking lowering migration, or at the very least defuse it from the big cities, as it seems foreigners are clogging up our roads. (At least they stopped stealing our sheep!)

The claim seems to follow a simple rationale:
1. Cities (e.g. Melbourne and Sydney) are getting bigger
2. The increase is mostly driven by overseas migration
3. This is putting more people on the roads
4. Hence increased traffic congestion (and insinuations of other social ills)

In short, migrants = traffic congestion. A simple, winning argument.
Except, I’m not convinced it’s true.

Points 1 and 2 are fine. Overseas migration is the largest component of population growth in Australia, particularly our largest cities. Point 3, on the other hand, seems flawed in two ways:

a. The driver: increased congestion could be caused by centralisation of workforce, and
b. Diversity: not all people are equal (in how they travel to work).

While they may appear minor oversights at first, these flaws are so fundamental that migrants may not only be a non-issue, but in fact part of the solution.


Are we jumping to conclusions?

But before we begin, is it worth questioning the conclusion in the first place? How much worse is congestion getting in our big cities? According to the Grattan Institute “the length and time of commutes barely changed in Australia’s biggest cities during the exceptionally rapid population growth between 2011 and 2016. In Sydney, Melbourne, Brisbane and Perth, commute distances in 2016 were almost indistinguishable from 2011″¹.


Let’s focus on Melbourne city to examine this further.

The number of people who work in Melbourne city grew 21% in the period 2011 to 2016, from 347k to 422k². That’s way faster than Melbourne’s overall population increase of 13% in the same period. The increase in CBD jobs may also be driven by the changing make up by industry, i.e. the increase in professional, hospitality, and finance jobs which tend to be more centralised. So, it’s likely there would be more people working in the CBD even without the new migrants.

Yet, even though the number of city workers has increased by 75,000, there’s only 4,000 more people driving into town in 2016 than there were in 2011. That’s because the way in which people travel to work has changed. A smaller percentage drive, and a greater percentage catch public transport, walk/ride or work from home.
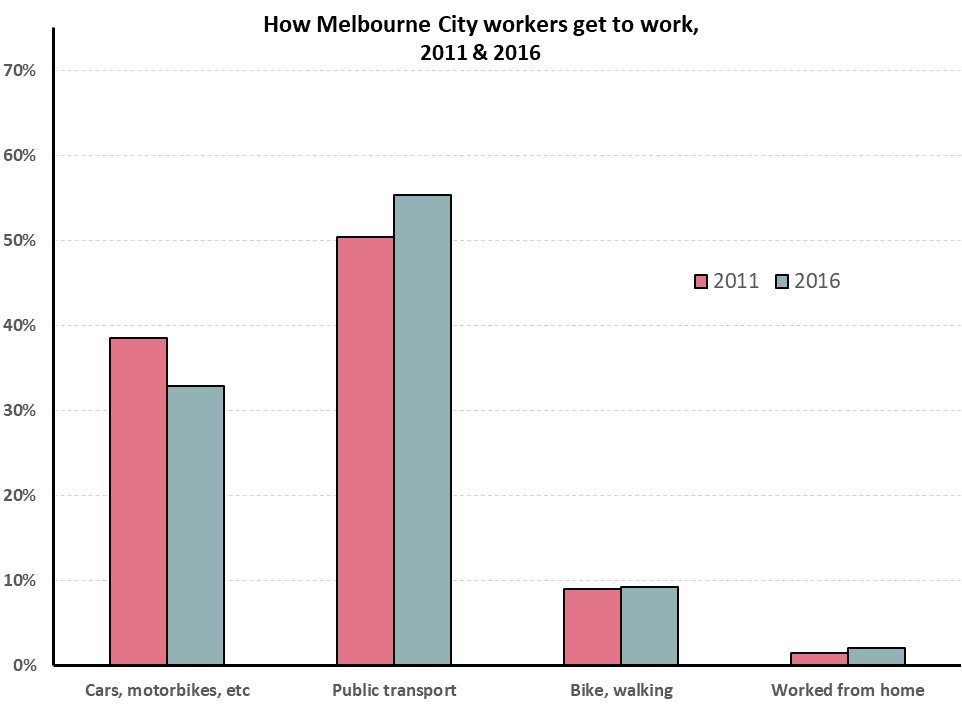
 

This change seems to be led by recent migrants. City workers who are long term Melbourne residents (i.e. have lived within the Melbourne Metropolitan area for at least 5 years) are 2.5 times more likely to drive to work than recent migrants. While recent migrants are almost 2.5 times more likely to walk or ride to work. Workers who moved to Melbourne from elsewhere in Australia (including country Victoria or interstate), fall somewhere in between.


If the percentage of people driving into town had not changed since 2011, Melbourne would have had an extra 14,000 cars on the road in 2016, not the 4,000 increase which occurred.

This of course is also overly simplifying. Congestion would also have changed the choices of the long-term Melbourne residents if they needed to take on city jobs. But I doubt it would have changed them enough as to resemble the choices of recent migrants. This would include large social changes, an increased acceptance of inner-city apartment living, and waving goodbye to the American Australian home-owning dream.

Similarly, Melbourne could move away from its current thriving tech, financial, educational and hospitality industries which centralise the workforce in town. Specially as without the recent migrants Melbourne would struggle to fill those jobs, as the skills may not be available locally.

But in the current world, the fact that such a large percentage of city workers are recent migrants seems to be the main reasons our roads are not at a stand-still.


Sources:

  1. Terrill, Marion, Batrouney, Hugh, Ha, James, and Hourani,Diana (2018). Remarkably adaptive: Australian cities in a time of growth. Grattan Institute.
  2. All travel to work data sourced form the Australian Bureau of Statistics, Census 2011 and 2016.

For whom the slots toll

For whom the slots toll

Australians love to poke a pokie. Or so it seems judging by the $12 billion spent every year down the slots. This figure (which accounts for just over 50% of all gambling losses in Australia) is also a significant proportion of Australians’ entertainment budget, almost equalling the $14 billion spent every year on domestic holidays.

But who is dropping all the coins in the slots?

Gambling statistics are notoriously under-reported in surveys, presumably because of our socially undesirability bias (i.e.: we under report things which we think make us look bad, and over-estimate things which make us look good!). This makes demographic data about the people involved particularly hard to find.

(Side note: This bias is so strong that ABS ‘s Household expenditure statistics under-report gambling by a factor of 11; the HILDA (Household, Income and Labour Dynamics in Australia Survey) does better but still under-reports gambling by almost 300%, and pokies by a factor of almost 7.)

We do however, have information about where the money is spent. Assuming most pundits at the local pokies pub are locals, we can say that pokies are the game of choice (or addiction) of the poor and disadvantaged. Pokies expenditure per capita was 6 times higher in Melbourne’s poorest Local Government Areas than in the wealthiest ones. Income, Disadvantage indexes and Newstart payments (unemployment benefits) all correlate strongly with pokies losses.


It’s unclear how accurate these estimates, however, I reckon they’re probably underestimates of how well correlated these characteristics are. I assume poor folk play the pokies in their local pubs, as well as sometimes at pubs in town, or in “destination” areas. I doubt this is the case with folk from richer areas travelling to poorer, less hip areas to play the pokies. Also, I think the expenditure in the CBD and inner suburbs (the wealthy ones) is over represented in tourist expenditure. Therefore, I think the “per capita” for rich locals is actually less than the figures calculated above, and the poor folks’ is underestimated. This suggests to me that the correlation is stronger than the figures show.

Surprisingly, at least for me, pensioners and the aged do not correlate highly with pokies.

I’m not generally a fan of paternalistic rules. And I dare say most people play the pokies as a form of entertainment. But I’m willing to consider them when they target addictions, especially those affecting the more vulnerable among us.

Perhaps it’s time to heed Tim’s message and blow up the pokies… or at least consider the PC’s recommendations and introduce some limitations.


Walking away from the altar

Walking away from the altar

Almost a quarter of a million people will get married in Australia this year, and only a quarter of those will choose a religious minister to conduct their wedding.

Religion, it seems, has an ever decreasing role in Australian weddings.

reli-weds-23

Roughly speaking, Australians today are half as likely to have a religious wedding as their parents, and less than a third as likely as their grandparents[1].

Voter demographics, however, do not reflect those about to walk down the aisle (or whatever kids do at weddings these days).

reli-weds-3

  • 70% of people getting married are under 35
  • 70% of voters are over 35!

If current trends continue, weddings are less and less likely to be officiated by religious ministers.

Should a community with an outdated view of religion’s role in marriage have a say on what role it has in the future?

Sometimes the future is so obvious; to stand in its way seems little more than a petulant stomp.


Featured Image:
Mr & Mrs Beyer, circa 1876-1882
Author/Creator: Stewart & Co., photographer.
Date: ca. 1876-ca. 1882

Sourced from the Victorian State Library:

http://www.slv.vic.gov.au/search-discover/explore-our-digital-image-pool/view_image?record_key=2680419


Data:

  • 3306.0.55.001 – Marriages, Australia, various years (http://www.abs.gov.au/ausstats/abs@.nsf/mf/3306.0.55.001)
  • 3310.0 – Marriages and Divorces, Australia, various years (http://www.abs.gov.au/ausstats/abs@.nsf/mf/3310.0)
  • 2011 Australian Census (http://www.abs.gov.au/websitedbs/censushome.nsf/home/Census?opendocument&ref=topBar)


[1] Broadly calculating the average, based on average age of weddings over the past 50 years, the average grandparent was married in the late 1950s.

The death of dying

The death of dying

Life is getting longer.

Life expectancy in Australia grew from 50 years in the late 1800s, to 70 in the 1960s, to 82 or so today. And we’re nowhere near finished.  But while many are aware of this, not many appreciate the magnitude of this achievement, nor its continuous impacts.

Perhaps there’s a lack of newspaper headline moments claiming “1,000 people did not die yesterday”.  Or perhaps it’s because people think lives are merely being elongated when we’re at our worst, forcing us into a dependent cycle of medical attention from which the doctors gain more than the patients.

Yet, neither of these is entirely true.

Making headlines every day

While 154,000 Australians died in 2014 (latest data available), the figure would have been closer to 176,000 (22,000 more deaths) had the mortality rate not improved in the last 10 years. (And 10 years is hardly a long time. In today’s currency, it’s barely 5 Prime Minsters ago.)  Improvements since 2004 are saving an extra 2,200 people each year, on average.  To put it in perspective, around 230 people are murdered in Australia each year. So mortality improvements, which rarely rate a mention, are saving 10 times the number murdered more every year than the last!

Seeing as murders are front page material, mortality improvements should have their own weekend section.


Saving lives at all stages

Unlike popular opinion, extending life expectancy is not about delaying death while holding people to ransom, feeding them mashed cauliflower through transparent tubes.  Death rates for teenagers and kids under 5 year-olds have both decreased by a third.  Basically, we’ve saved 1 in 3 of the teenagers (and babies) who would have died had the improvements not occurred.

Had we saved a third of the price of electricity Josh Frydenberg would have declared it a national holiday.

All ages decreasing


These decreases were not a once off, nor were they specific to one group.  Improvements across the younger years have been pretty steady over the past decade.

constant decreast young


Improvements in mortality rates translate into less people dying than would have under the previous rates.

Deacreading death is people


As expected, the majority the decrease in deaths occurs at the latter stages of life.  Though surprisingly, the only cohort with an increasing mortality rate are those over 95 years of age.  And yet, the improvements are so large that even though the younger cohorts make up smaller percentages, they are still newsworthy. Without the improvements of the last 10 years, 2014 would have seen the death of around:

  • 376 more kids under 5
  • 124 more teenagers
  • 426 more people in their 20s
  • around 3000 more working aged folk (15-65 year-olds)

Instead, our attention is focused on gruesome anecdotes of villains and victims.  A hero cowardly king-hit, a young family destroyed by a murder-suicide, three teenagers overdosing on ice behind the local servo, or a joy ride gone awfully wrong.  Without balancing these out with the constant excitement of decreasing mortality and longer lives, we fall into a pessimistic spiral of despair.  We fail to recognise the huge progress made and foster a sense of nostalgia for times which were in fact significantly worse.

Shit’s never been this good. We’re just too busy reading the headlines to realise it.


Source:

Death figures sourced from : ABS Deaths Publication, 2014 http://www.abs.gov.au/ausstats/abs@.nsf/mf/3302.0

Converted to rates using ERP by age

Those who can’t afford, rent.

Those who can’t afford, rent.

With so many budding photographers around Australia, it’s surprising the housing affordability conversation is so out of focus. It seems the pressure is on people paying hundreds a week into someone else’s investment, not on those depositing hundreds of thousands into their own investment bricks. While it may not impact the average Joe, nor Jane next door, rental (un)affordability seems to have a greater impact than the housing bubble on everyone’s lips.

One way to compare the pressures faced by renters and buyers is by analysing their decisions, or those they are forced into. This analysis, like a previous article,  focuses on small families (couples and single parents) with one or two children.  This is mostly to simplify comparisons, looking at a more homogeneous group, rather than drawing conclusions from a wider, more disparate cross-section of the community.

As previously shown, the majority of small families live in homes with a spare bedroom or two. However, a smaller section can’t afford enough bedrooms to go around. For some this means siblings sharing bedrooms, and for a smaller group the parents cohabitate with the kids.

Housing affordability might be affecting buyers and renters, but the figures below show that the pointy end of the rental market pricks more.

Based on 2011 Census data, couples with one child who rent are 8 times more likely to have to share rooms with their child than those who own or are buying their home. For single parents the ratio is 4 to 1. Likewise, families with 2 kids (couples and single parents) who rent are 5 times more likely to make their kids share a room than families who own or are buying.

Insufficient rooms

These families make up a very small proportion of the whole community. But this still affects over 5,400 single-child families living in homes with 1 bedroom or less (studio).

While I personally believe sibling make for great room-mates while growing up, modern Australian culture prefers otherwise, and the decision for kids sharing rooms is shaped somewhat by financial pressures. When parents share a bedroom with their kids, it’s even clearer that financial pressures forced them into an undesired situation.

Whether or not this issue’s media attention is disproportionate overall is a separate question, but perhaps we should pay less attention to those attempting to join the bourgeoisie, and more to the smaller groups facing eviction notices.


Affordability, it’s a matter of expectations

Affordability, it’s a matter of expectations

There is no doubt that Australian property prices are increasing at a rapid rate. Affordability, however, may depend on expectations.

There is a difference between something being unaffordable and it rapidly increasing in price. The topic of housing affordability has been on high rotation in Australian politics for the past few years.  It’s the pinnacle of two topics du jour: Capital Gains Tax and Negative gearing. Much has been written about the impact these two policies have had on house-prices since the 1980s.  However, most articles focus on the speed of the price increase, not on whether houses are relatively ‘affordable’?  What is affordable? Would we think houses affordable if prices dropped by a third?

Much was made of Turnbull’s interview with the one-year-old who negatively geared property (or at least her parents did), and how out of touch the sentiments of the interview were. But it is generally acceptable, on the other hand, for a couple with a 4-month-old to own a home with spare rooms¹.

“We don’t have unreasonable expectations, but those three-bedroom apartments and townhouses are cost prohibitive ….” said Ms Rule-Layton, Coburg.

Census figures show that when it comes to young families with one or two children, spare bedroom(s) are by far the norm, not the exception.

Of the 207,000 couples with one child owning (or paying off) a home in 2011, 91% had at least one spare room. Almost half of these had 2 spare bedrooms or more.

The situation is surprisingly similar for single parents with one kid.  More than 4 out of 5 had at least one spare bedroom, and 27% at least 2.

When it comes to 2 children families, the question of spare bedrooms is slightly more complicated as the issue of sharing bedrooms arises.  Statistics usually show you how many people and rooms there are per home, but not whether kids share rooms making others spare, etc.  However, only 3 in 100 home-owning couples with 2 kids had insufficient rooms for their kids not to have one each.  This figure only rises to 5 in 100 for single parents with 2 kids.

Couples kids rooms

According to the Real Estate Institute of Victoria, 3bdr apartments and houses in inner Melbourne are on average 54% and 32% more expensive than the 2bdr variety.  That roughly equates to an extra $310k for the 3rd bedroom of an apartment, and $285k in a house.

This ratio may not be representative of the whole country but it does suggest that the 3rd bedroom contributes substantially to the price of the dwelling (approximately 30% across the greater Melbourne).

Would homes be deemed affordable today, if the price dropped by this amount?

If families were willing to live without the luxury of a spare bedroom, this saving becomes a real possibility. This relates to the 9 out of 10 couples with one child, and 55 out of 100 couples with 2 children.  Also, to the 42 in 100 families with two kids who have individual rooms.

However, it seems Australians fear room sharing more than they do debt.


The extra bedroom phenomenon is not limited to Australia’s elite. The ratio of houses with at least one spare room is remarkably similar across all socio-economic backgrounds for couples and single-parent families with one child. The difference becomes noticeable on households with 2 or more spare bedrooms.

Couples rooms deciles

Single parentsrooms deciles

And while the spare bedroom, beyond individual kids’ rooms becomes more difficult for the less well-off families, only 9% of the poorest single-parent families don’t have enough rooms for their kids to sleep separately.

Single parentsrooms deciles 2 kids

There is no doubt that Australian property prices are increasing at a rapid rate. Affordability, however, may depend on expectations.

Australia’s housing standards are amongst the highest in the world. The OECD ranks Australia’s housing at 4t4h highest out of the 36 compared in the Better Life Index². Furthermore, within this champagne crowd Australia’s housing costs come a timid 11th cheapest (of the 36) in terms of housing costs vs disposable household income.

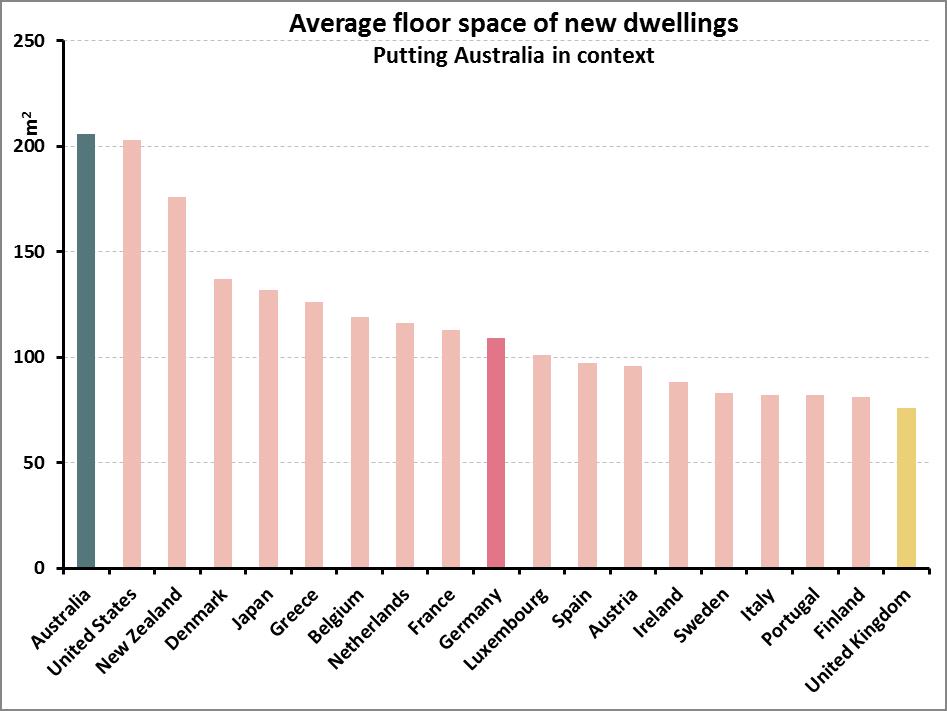
Not only are Australian housing standards particularly high, but they are also improving fast. The average floor-space of new homes increased by almost 40% since 1985³, to 208 metres2 in 2013. To put this in context, the average new home in Germany is 109m2 and in the UK it is 76m2.

Average space home

Based on the best international comparisons I could find4, Australia leads the way in size of new dwellings, easily doubling the size of many European countries’.

Apples w watermellons

So, when we hear international house price comparisons, it’s worth remembering we’re not always comparing apples with apples, but rather their apples with our watermelons.

Does Australia have a housing affordability crisis? It’s hard to say. It depends on your definition of affordable. However, there is a lot of room to move if we want to decrease the cost of housing without lowering our standards beyond what is considered acceptable across the rest of the world’s richest countries.

After all, do we even want our in-laws to have a spare room at our place to crash in?  Save yourself the $300k, and shout them a five-star hotel for the few nights a year they do visit the grandkids.


[1] http://www.domain.com.au/news/melbourne-apartment-boom-is-it-working-for-buyers-and-residents-20160429-gogjvs/

[2] http://www.oecdbetterlifeindex.org/topics/housing/

[3] http://www.abs.gov.au/AUSSTATS/abs@.nsf/Previousproducts/8752.0Feature%20Article1Jun%202013

[4] http://www.demographia.com/db-intlhouse.htm

Smoking the poor

Smoking the poor

Australia’s 2016-17 budget announcement included “four annual 12.5 per cent increases in tobacco excise and excise equivalent customs duties”, claiming it will raise “$4.7bn over the next four years”.¹

This is unlikely to face much opposition. After all, taxing smoking aims to discourage the leading cause of preventable deaths in Australia².

But it’s interesting to see who will be most impacted by this, as smoking is a poor person’s game.

Based on 2009-10 household expenditure data³, increasing the cost of smoking will have a much larger impact on the poorest sectors of the community than anyone else.  More specifically, it will impact households receiving unemployment, disability, and carers payments – those already under the most amount of financial strain.

Smoking poor

Back in 2010, the poorest 20% of households were already spending four times as much of their weekly expenditure as the richest 20%.  Households whose main source of income was unemployment benefits spent three and half times the national average on tobacco, in relation to their total income.  Those whose main income was disability and carer payments spent three times the national average.

This is likely to be much more accentuated today as the 25% annual increase in tobacco excise since 2010 has almost doubled the price of cigarettes since that data was produced[4].

So how will this picture look in 4 years’ time, after 8 years of tobacco increases, when a packet of winnie blues cost $50?

Smoking is addictive. I suspect it’s easier to sell a house than quit smoking. Yet, when governments change legislation, making previous decisions less financially desirable, there’s usually talk of ‘grandfathering’ policies. That is to say that if we ever change capital gains policies we’ll ensure those who got in on the action prior to the changes don’t lose out.  Should similar considerations be made with smokers? Or is this more like the drug dealer who gives away the first few hits until you’re hooked, and then jacks up the prices, marginalising the destitute to a life of crime, imprisonment and social isolation?

I suspect it’s not all bad. Many will quit, thus improving their lives, and those of their loved ones. But for those unable to let go of nicotine’s vice, I suspect health issues will be only part of their worries.


[1] http://www.budget.gov.au/2016-17/content/glossies/tax_super/html/tax_super-05.htm#health

[2] http://www.quit.org.au/resource-centre/facts-evidence/the-big-kill

[3] http://www.abs.gov.au/AUSSTATS/abs@.nsf/Lookup/6530.0Main+Features12009-10?OpenDocument

[4] http://www.tobaccoinaustralia.org.au/13-3-the-price-of-tobacco-products-in-australia

Death Tree

Death Tree

Not quite as cool as the Death Star, this Death Tree breaks down the 153,580 deaths which occurred in Australia in 2014, by cause:

Interpreting the Tree
Size of the box shows relative number of deaths, compared to all other deaths.
The colour represents the sex divide.
The bluer boxes represent diseases which kill more men than women. The yellow boxes kill more women than men. The legend on the top right provides a guide as to the sex representation.

Navigating the Death Tree
Left clicking drills down into finer level causes (e.g.: Cancer breaks down into Lung cancer, colon cancer, breast cancer, etc.).
Right clicking drills back up.

All causes are classified using the International Classification of Diseases (ICD).

The Death Tree provides a bigger, more user-friendly representation.

In the meantime, here is a smaller embedded version:

Everyday people, everyday deaths

Everyday people, everyday deaths

You may not have read it in the newspapers this morning, nor on social media, but 421 Australians died yesterday. And the day before. And most likely today too. Roughly speaking of course, averaging out the 153,580 who died over the course of 2014¹. (Coincidentally, 153,000 is roughly how many people die worldwide per day².)

The media may focus on the half a person murdered per day, or the 3.8 people tragically killed on the roads, but to use a common idiom, the majority of people who died in 2014 (55%) ‘had a good innings’. (A good innings, in my eyes, equates to living past 80.) But this has not long been the case. Until 2005 less than half of Australians who died each year reached 80. In fact, the percentage of people who died before reaching 80 was 44% in 2000, 34% in 1990, and 29% in 1980³.

The graph below shows the percentage of deaths by age group, since 1910.Age of death 1910-2013

The gains achieved over the past 115 years are huge. Much of the improvement, in particular in the first half of the century, was a result of decreased infant (under 1) and child (1 to 4 years) mortality. Infant deaths decreased from 81 deaths per 1,000 live births in 1910 to 25 per 1,000 in 1950, to just 3 in 2014 [4].

The improvements over the last 50 years, however, have also been driven by decreased rates of death in older Australians. This, in no small part, is a result of the improved ways in which we deal with heart disease. Heart disease is “the largest single cause of death in Australia” [5], but if current trends continue it won’t be for long. While heart disease (ICD-10 I20–I25) accounted for 30% of all deaths in 1970, by 2014 this had decreased to 13%.

Over the past 18 years heart attacks (which account for about half of all heart disease deaths) have dropped from 13% of all deaths to 6%. Dementia on the other hand, has increased from 1% to 5%. The changes have been so pronounced that dementia now kills more women than heart attacks do.

Heart attcks vs dementia

Since 1997, the number of heart disease deaths has reduced by an average of 505 people per year. That’s twice the average number of murder victims per year (which itself is decreasing).

Society is not getting more violent, or more dangerous. But improvements in the way we treat health conditions have dramatically improved and extended our lives.

If the amount of attention on scientific and medical improvements, as well as sensationalised but unlikely scenarios, more accurately reflected reality, perhaps we would have a very different perception of our state of affairs.

Shit’s getting better. Way better.

_

To better understand what people die of these days, the Death Tree Map linked here shows all Deaths in Australia in 2014 by cause. Clicking each category drills into finer categories in greater detail (i.e. Cancer breaks down into Lung cancer, colon cancer, breast cancer, etc.). Right clicking drills up.
The colour represents the sex divide. The bluer boxes represent diseases which kill men more than women. The yellow boxes kill more women than men. The legend on the top right guides the sex representation.
(below is a smaller representation of the Death Tree Map)


[1]http://www.who.int/mediacentre/factsheets/fs310/en/index2.html[2]http://www.abs.gov.au/AUSSTATS/abs@.nsf/Lookup/3302.0Main+Features12014?OpenDocument[3]http://www.aihw.gov.au/deaths/grim-books/[4]http://www.abs.gov.au/ausstats/abs@.nsf/0/C6A9CBD96E6BA43DCA257943000CEDF5?opendocument[5] http://www.aihw.gov.au/WorkArea/DownloadAsset.aspx?id=60129547044


De-constructing the ‘g’ gap

De-constructing the ‘g’ gap

Last week was International Women’s Day so everyone should be up to date with the latest estimate of the gender pay gap (17%), and very well versed on at least three theories behind it.

Now, then, might be the perfect time to ask why the social progress and workforce changes which occurred over the last 30 years have had no impact on the gap.

The increasing awareness, numerous policies, university attendance explosion, increasing maternity leave and participation rates, industrial and occupational distributions, and a myriad other variables have increased or decreased to varying degrees. Mostly towards gender parity. Yet the pay gap for full-time women has not deviated more than +/- 2 percentage points since Lionel Ritchie first sang “Hello…. is it me you’re looking for?!”[1].

Gender Pay gap 83 15

The gap itself is a complex issue with many moving parts. This is a look at a few of those parts, and a general wondering: how is it not improving?


An aging workforce

One of the biggest changes in the workforce has been workers’ age. Average full-time wages increase rapidly with age, until they begin plateauing around 30, finally peaking in the late 30s to mid 40s (depending on occupation and role).  On average, workers under 25 earn 40% less than those 25 years and over[2].

Historically, one of the reasons behind the wage gap has been that working women are dis-proportionally younger than men, and therefore lower paid (i.e. junior staff on junior wages).  But the age demographic across the sexes has become a lot more equal over the last few decades.

While the overall percentage of workers under 25 has halved since 1983, women’s compositional distribution has changed much more than men’s (as shown by the graph below)[3].

Aging workforce by Sex

This suggests junior wages, or wages from young staff who are yet to reach role maturity, should have a much smaller impact on the overall average wage than it used to. Thus, diminishing one reason why there may be a pay-gap.

On the other end of the maturity spectrum, the proportion of women over 40 has almost doubled since 1983.  This suggests a greater proportion of women are returning to full-time employment after giving birth, continuing to build on their careers, with advanced wages.

Aging workforce by catergories

The changes in women’s labour force have been so substantial that the average age gap between the sexes is less than a quarter of what it used to be: down from 4.5 years in 1983 to 1 year gap in 2015.

This said, women have not achieved age parity in the workforce, but it’s certainly a lot closer than it used to be. Yet, the pay-gap has not changed since ‘Return of the Jedi‘ hit the cinema screens.


Women learning it for themselves

One potential reason behind the maturing female workforce is the increasing number of women attending university.  University attendance has increased across the board, but women’s increase has doubled men’s.  While women had not achieved tertiary education parity by the early 80s, they well and truly have by 2015.  In 2013, 58% of all Australians studying at university are women. This is just as true for postgrads as it is for undergrads. In fact, women have been the majority at uni since 1987[4].

This increase in university attendance has flowed to the labour force.  Full-time working women are now 45% more likely to have graduated from university than their male counterparts.

Uni Attainment in LF by sex

However, not all graduates are created equal. Some fields of study pay more than others, and the figures above don’t provide that level of detail. But overall graduates earn substantially more than workers with no university qualifications, and women are increasingly dominating this sphere.

This further suggests a move towards pay parity.  Yet, the pay-gap has not changed since Bob Hawke first became Prime Minister of Australia.


From doing to managing – occupational changes

Higher paid occupations (e.g. managers and professionals) now make up much larger proportions of the workforce than they did in the mid80s. Whether it’s due to social progress, the growing number of university educated women, or any other reason, the proportion of women in these roles has increased faster than men’s over the period in question.  The proportions of full-time women in the two highest paid occupations, professional and managerial roles, have increased 12 and 6 percentage points respectively. Men, on the other hand, increased 7 and 2 percentage points.

To balance this out, the proportions of women filling admin, labouring and sales roles (the three lowest paid occupations) have decreased by 11, 4 and 3 percentage points, to men’s 2, 4 and 1.

The graph below compares the proportion of women and men by occupation in 2015 to 1986. Higher paid occupations have generally increased, and low paid decreased… and women have faired better at both ends of the spectrum.


Occupation can still account for some of the current disparity. Despite the move towards higher paid roles, women are still over represented in some of the lower paid occupations; e.g. 25% of women fill admin roles, as opposed to 7% of men. But the changes over the past 30 years should have had an impact on the pay disparity.

Yet, the pay gap has not changed since the average price for a Melbourne house was $52,000[5].

Changing occupations by sex2

Mining the AGEING boom

Unlike the other variables examined, women have not clearly moved to the higher paid industries over the past 30 years. In fact, women have slightly decreased proportional representation for the three highest paid industries when compared to men (i.e. mining, financial and professional services). Mining is of particular interest as it is the highest income by almost $40k, and the boom meant its growth outstripped every other industry’s growth. These two aspects combine to help stretch the pay-gap further apart.

Changes in Industry distribution, by sex, 1984 to 2015

Changing industry by sex 3

The industry experiencing the largest increase in women participation has been Health Care and Social Assistance, potentially on the back of Australia’s ageing population’s demand. While its income is only marginally below the average for all industries, the increase in Health and Social assistants means women have not migrated towards the higher paid industries in large numbers.

Having said that, as previously described, women have gained much ground in GP representation.  The proportion of women GPs has increased from 22% in 1984 to 43% in 2014*.  This means that whilst women continue to be over represented in lower paid industries, they are filling higher paid roles within these industries.


Ask for more

Data on workforce by “method of setting pay” (i.e. opportunity to negotiate pay, which some suggest promotes disparity) has been hard to come by. This aspect may be extended upon in future.


Yet, not.

Most of these changes suggest the gender pay gap should have decreased over the past 30 years. At the very least it shows the variability of many contributing aspects. To not have achieved pay parity is understandable, as there are still many obstacles to overcome, and underlying contexts/assumptions/social norms to change. And many tricky issues to figure out on how to get there.

  • Should more women work in higher paid industries, or should we (financially) value women-dominated industries more?
  • Are health and education paid less because they are women heavy industries, or are they women-dominated because they are lower paid?
  • Should we increase paternity leave to support women to stay, or support them to return after birth-giving?
  • Should women be encouraged to negotiate more or should industrial frameworks diminish the impact negotiation has on individual’s pay?

But to not have made any improvement, despite all the changes that have occurred seems odd. Changes in age  alone should have had massive impacts.

Yet, not. No change, improvement or otherwise.

This post has no answers or suggestions… just a baffled look to greater minds to tells us why…


[1] Based on Full-time ordinary wages, by sex from Average Wages, ABS: http://www.abs.gov.au/AUSSTATS/abs@.nsf/DetailsPage/6302.0Nov%202015?OpenDocument

[2] http://www.abs.gov.au/AUSSTATS/abs@.nsf/DetailsPage/6306.0May%202014?OpenDocument

[3] http://www.abs.gov.au/AUSSTATS/abs@.nsf/DetailsPage/6291.0.55.003Nov%202015?OpenDocument

[4] http://docs.education.gov.au/system/files/doc/other/time_series_data_1949_-_2000.pdf and http://highereducationstatistics.education.gov.au/

[5] http://www.econ.mq.edu.au/Econ_docs/research_papers2/2004_research_papers/Abelson_9_04.pdf


Australia’s war on what

Australia’s war on what

The incarceration rate in the U.S. is ridiculous, but it wasn’t always like this.

The 1970s kicked-off the ‘tough on crime’ and ‘war on drugs’ period, which has had such an impact that the U.S. now has the highest prisoner rate in the world (discounting Seychelles), and currently stands at over 4 times the OECD average¹. In fact, the U.S.’s willingness to imprison its people is so out of step with the rest of the world that it now hosts almost a quarter of the entire world’s prisoners².

Yet, the incarceration rate of Australia’s Aboriginal and Torres Strait Islander people is more than twice³ the rate of the U.S. … and growing!

The first graph has been doing the rounds for the last couple of years, and shows how the U.S.’s willingness to imprison its population has changed over the last few decades.

The second graph compares the American rate to that of Aboriginal and Torres Strait Islander people in Australia.

How bad is the crime situation in Australia that has lead to this?


[1] http://www.oecd-ilibrary.org/sites/factbook-2010-en/11/04/01/index.html?contentType=%2Fns%2FStatisticalPublication%2C%2Fns%2FChapter&itemId=%2Fcontent%2Fchapter%2Ffactbook-2010-95-en&mimeType=text%2Fhtml&containerItemId=%2Fcontent%2Fchapter%2Ffactbook-2010-95-en&accessItemIds=&_csp_=4f5272543a5f9d2bef941b4101f970ae

[2]  Roy Walmsley (November 21, 2013). World Prison Population List (tenth edition)International Centre for Prison Studies.

[3] Comparisons across international jurisdictions are more complicated.  Generally the ABS figures for rate of imprisonment is based on all people in jail per 100,000 adults. The US figures in the historical data presented here, however, only include ‘prisoners sentenced for 1 year or more’. The graph provided shows comparable data, based on the same variables. The relevant Australian figures for Aboriginal and Torres Strait Islander people are derived using data in Table 10 of ABS’s Prison publication linked below.

U.S. Data for 1925 to1977 from http://www.albany.edu/sourcebook/pdf/section6.pdf

U.S. Data 1978 to 2014 from http://www.bjs.gov/ –  Corrections Statistical Analysis Tool (CSAT) – Prisoners

Australia Data: http://abs.gov.au/AUSSTATS/abs@.nsf/allprimarymainfeatures/8D5807D8074A7A5BCA256A6800811054?opendocument

Prisoner publication 2005 to 2015 – please request derived figures. Planning to have datasets available online in future.


4:  Picture used with CC authority, thanks to: www.flickr.com/photos/marineperez/4698707308

Picture changed to highlight that 1 in 3 people in Australia’s jails are Aboriginal and Torres Strait Islander.