Last week was International Women’s Day so everyone should be up to date with the latest estimate of the gender pay gap (17%), and very well versed on at least three theories behind it.
Now, then, might be the perfect time to ask why the social progress and workforce changes which occurred over the last 30 years have had no impact on the gap.
The increasing awareness, numerous policies, university attendance explosion, increasing maternity leave and participation rates, industrial and occupational distributions, and a myriad other variables have increased or decreased to varying degrees. Mostly towards gender parity. Yet the pay gap for full-time women has not deviated more than +/- 2 percentage points since Lionel Ritchie first sang “Hello…. is it me you’re looking for?!”[1].

The gap itself is a complex issue with many moving parts. This is a look at a few of those parts, and a general wondering: how is it not improving?
An aging workforce
One of the biggest changes in the workforce has been workers’ age. Average full-time wages increase rapidly with age, until they begin plateauing around 30, finally peaking in the late 30s to mid 40s (depending on occupation and role). On average, workers under 25 earn 40% less than those 25 years and over[2].
Historically, one of the reasons behind the wage gap has been that working women are dis-proportionally younger than men, and therefore lower paid (i.e. junior staff on junior wages). But the age demographic across the sexes has become a lot more equal over the last few decades.
While the overall percentage of workers under 25 has halved since 1983, women’s compositional distribution has changed much more than men’s (as shown by the graph below)[3].

This suggests junior wages, or wages from young staff who are yet to reach role maturity, should have a much smaller impact on the overall average wage than it used to. Thus, diminishing one reason why there may be a pay-gap.
On the other end of the maturity spectrum, the proportion of women over 40 has almost doubled since 1983. This suggests a greater proportion of women are returning to full-time employment after giving birth, continuing to build on their careers, with advanced wages.

The changes in women’s labour force have been so substantial that the average age gap between the sexes is less than a quarter of what it used to be: down from 4.5 years in 1983 to 1 year gap in 2015.
This said, women have not achieved age parity in the workforce, but it’s certainly a lot closer than it used to be. Yet, the pay-gap has not changed since ‘Return of the Jedi‘ hit the cinema screens.
Women learning it for themselves
One potential reason behind the maturing female workforce is the increasing number of women attending university. University attendance has increased across the board, but women’s increase has doubled men’s. While women had not achieved tertiary education parity by the early 80s, they well and truly have by 2015. In 2013, 58% of all Australians studying at university are women. This is just as true for postgrads as it is for undergrads. In fact, women have been the majority at uni since 1987[4].
This increase in university attendance has flowed to the labour force. Full-time working women are now 45% more likely to have graduated from university than their male counterparts.

However, not all graduates are created equal. Some fields of study pay more than others, and the figures above don’t provide that level of detail. But overall graduates earn substantially more than workers with no university qualifications, and women are increasingly dominating this sphere.
This further suggests a move towards pay parity. Yet, the pay-gap has not changed since Bob Hawke first became Prime Minister of Australia.
From doing to managing – occupational changes
Higher paid occupations (e.g. managers and professionals) now make up much larger proportions of the workforce than they did in the mid80s. Whether it’s due to social progress, the growing number of university educated women, or any other reason, the proportion of women in these roles has increased faster than men’s over the period in question. The proportions of full-time women in the two highest paid occupations, professional and managerial roles, have increased 12 and 6 percentage points respectively. Men, on the other hand, increased 7 and 2 percentage points.
To balance this out, the proportions of women filling admin, labouring and sales roles (the three lowest paid occupations) have decreased by 11, 4 and 3 percentage points, to men’s 2, 4 and 1.
The graph below compares the proportion of women and men by occupation in 2015 to 1986. Higher paid occupations have generally increased, and low paid decreased… and women have faired better at both ends of the spectrum.
Occupation can still account for some of the current disparity. Despite the move towards higher paid roles, women are still over represented in some of the lower paid occupations; e.g. 25% of women fill admin roles, as opposed to 7% of men. But the changes over the past 30 years should have had an impact on the pay disparity.
Yet, the pay gap has not changed since the average price for a Melbourne house was $52,000[5].

Mining the AGEING boom
Unlike the other variables examined, women have not clearly moved to the higher paid industries over the past 30 years. In fact, women have slightly decreased proportional representation for the three highest paid industries when compared to men (i.e. mining, financial and professional services). Mining is of particular interest as it is the highest income by almost $40k, and the boom meant its growth outstripped every other industry’s growth. These two aspects combine to help stretch the pay-gap further apart.
Changes in Industry distribution, by sex, 1984 to 2015

The industry experiencing the largest increase in women participation has been Health Care and Social Assistance, potentially on the back of Australia’s ageing population’s demand. While its income is only marginally below the average for all industries, the increase in Health and Social assistants means women have not migrated towards the higher paid industries in large numbers.
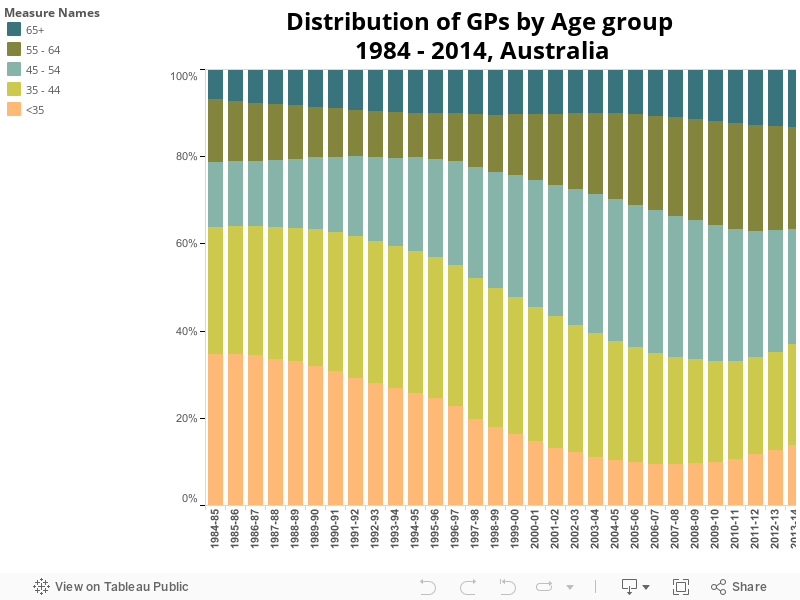
Having said that, as previously described, women have gained much ground in GP representation. The proportion of women GPs has increased from 22% in 1984 to 43% in 2014*. This means that whilst women continue to be over represented in lower paid industries, they are filling higher paid roles within these industries.
Ask for more
Data on workforce by “method of setting pay” (i.e. opportunity to negotiate pay, which some suggest promotes disparity) has been hard to come by. This aspect may be extended upon in future.
Yet, not.
Most of these changes suggest the gender pay gap should have decreased over the past 30 years. At the very least it shows the variability of many contributing aspects. To not have achieved pay parity is understandable, as there are still many obstacles to overcome, and underlying contexts/assumptions/social norms to change. And many tricky issues to figure out on how to get there.
- Should more women work in higher paid industries, or should we (financially) value women-dominated industries more?
- Are health and education paid less because they are women heavy industries, or are they women-dominated because they are lower paid?
- Should we increase paternity leave to support women to stay, or support them to return after birth-giving?
- Should women be encouraged to negotiate more or should industrial frameworks diminish the impact negotiation has on individual’s pay?
But to not have made any improvement, despite all the changes that have occurred seems odd. Changes in age alone should have had massive impacts.
Yet, not. No change, improvement or otherwise.
This post has no answers or suggestions… just a baffled look to greater minds to tells us why…
[1] Based on Full-time ordinary wages, by sex from Average Wages, ABS: http://www.abs.gov.au/AUSSTATS/abs@.nsf/DetailsPage/6302.0Nov%202015?OpenDocument
[2] http://www.abs.gov.au/AUSSTATS/abs@.nsf/DetailsPage/6306.0May%202014?OpenDocument
[3] http://www.abs.gov.au/AUSSTATS/abs@.nsf/DetailsPage/6291.0.55.003Nov%202015?OpenDocument
[4] http://docs.education.gov.au/system/files/doc/other/time_series_data_1949_-_2000.pdf and http://highereducationstatistics.education.gov.au/
[5] http://www.econ.mq.edu.au/Econ_docs/research_papers2/2004_research_papers/Abelson_9_04.pdf