Donating à la carte

Donating à la carte

Decisions are hard. Especially when the outcomes are important, the options are numerous, and relevant information is hard to find.

For many everyday decisions (where to eat, what clothes to wear, what to do tonight), I have a pretty good idea of what I can do, what I’d like to achieve, and how likely I am to do so. And despite most of these decisions being largely inconsequential I still consider them in great detail. I assume others are somewhat similar to me, delicately wasting their processing power on life’s minutiae.

Yet, of all the choices we make, one of the most impactful seems among the least rationally considered: donations.

We can donate to almost anything, anyone, at any time. But do we consider the options available before giving? And if so, how are we to weigh up the pain of a malnourished child to the impact of a polluted river; the needs of our local lifesaving club to the suffering of 100 battery hens; climate change to the housing needs of a woman escaping domestic violence?

We’re so overwhelmed by the immense number of possibilities that we often yield to impulse, emotion and social pressures. But these decisions deserve our most careful consideration. We have the power to change the status quo. And to ignore this is to choose to do nothing.

Thanks to the interwebs it’s now as easy to support locally as it is to support (almost) anywhere else in the world. So, we can cast as wide or as narrow a net as we like when looking to get behind a cause.


Modelling donations – a menu of causes

The model below presents the main options available for donations. Its aim is to help us make more conscious decisions, and explicitly remind us of what we’re ignoring.


Using the model – 2 paths to better donations

The model can be used in two ways:
1. Proactively – help guide your thinking when deciding on a cause, and
2. Re-actively –  recognise when a charity focuses on a particular group at the expense of others.


Method 1 is great for clarifying your personal values and systematically prioritising the areas you’d like to support.

Hypothetical example 1: the proactive method
I could start by acknowledging that I care more for people than animals and the environment. Then, I explicitly recognise a desire to help the local LGBTIQ community. Lastly, wanting to have an immediate impact, I support a charity which focuses on providing every-day services. This gives me the following combination:

Using the model as such can help articulate what I’m after, and find a charity which provides the desired service. If all charities were classified using this framework, then I could easily find an organisation to suit my needs.


Method 2 helps remind us of all the things we could be supporting before choosing a particular charity. When donating to a cause, we are implicitly choosing it above all others. The mapping exercise, i.e. explicitly acknowledging what we are focusing on, may highlight an excluded cause which, when considered, we find more worthy.

Hypothetical example 2: Check yo’self

If I’m a long-time supporter of an organisation sheltering dogs, it’s easy to continue doing so by focusing on the wonderful work the organisation does, and feeling great that I could help. However, by mapping their work to the model, I am forced to recognise there are many other animal species in need which I am implicitly ignoring. In fact, others’ need may be greater (either through the amount of cruelty experienced, or the sheer number being subjected to it); for example battery hens or caged pigs. With this realisation I can re-examine my values and act accordingly. If post-introspective I recognise I care more about the suffering of battery hens, then I can go back to Method 1 and better align my donations to reflect my values.


The Four Dimensions of Donations

The model has 4 main dimensions (with the key one broken down into subcategories)

1. The who (including ‘which subcategory’)
This helps differentiates between people, animals or the environment. Each of these key categories is broken down into further subcategories. For example, people can be dissected by religion, or sexuality, or age; animals by species; and the environment by ecosystem (rivers vs rain-forests vs oceans vs desserts, etc.).

2. The where (place)
This helps dictate the place and spread of the donating net. Are you interested in all specimens in the world equally, or do you have a particular attachment or concern over a region over all others?

3. The what (aspect)
Within each category there are different aspects which can be improved or supported. For people, helping improve health or education are pretty central, but there is also work done to support the arts, local sports clubs, churches or world peace. Animals and the Environment also have specific aspects which can be targeted, and these are presented in the model.

4. The how (support)
The how differentiates the different types of work which can help your cause. Should we act now, educate, try to change the decision makers, or continue researching to find better solutions? For example, if you want to help the world deal with climate change, would you prefer to support an organisation providing immediate direct work (e.g. decreasing emissions now) or should more funding be provided towards research in the hope that we discover a more efficient solution in the near future?

By combining the four dimensions, you can have a much better understanding of how you would like to help.


The why

The model does not cover how we do or should decide which box to focus on. That will form another post, hopefully in the near future. But the aim for now was to raise awareness to the breadth of work available, with the hope that before making quick impulsive decisions, we consider what we can do, and hopefully do more with what we give.


To be improved…

It goes without saying that this model is probably missing a whole bunch of stuff. So please let me know what’s missing so I can update it as we discuss.

Updates:
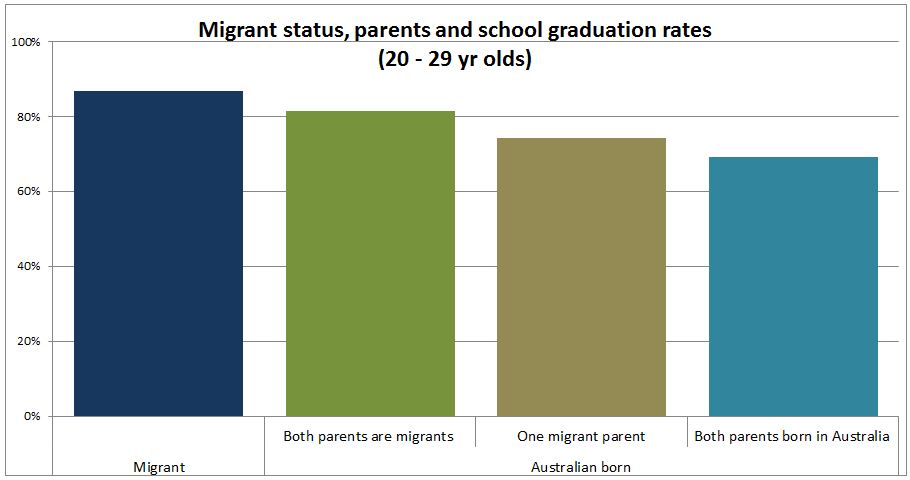
1st: Indigeneity and migrant status – from our UN correspondent! (How did I miss them?)
2nd: Biodiversity – Thanks Ms Sabrewing
3rd: Circumstance – From a recent dinner discussion, mentioning “Legacy”


The following documents were used in the development of this model:

NGOs
Guidestar: http://www.guidestar.org/NonprofitDirectory.aspx
Charity Navigator: https://www.charitynavigator.org/index.cfm?bay=content.view&cpid=34
Government organisations
UK – http://www.legislation.gov.uk/ukpga/2011/25/contents
USA – https://www.irs.gov/pub/irs-pdf/p4220.pdf
Australia – http://australiancharities.acnc.gov.au/


Too many cookies in the education jar

Too many cookies in the education jar

Much is being said of the government’s support of private over public education of late. Last week was accentuated by the Private school, public cost report suggesting private funding will soon overtake public, with other opinion pieces echoing its sentiments.

According to the research based on MySchool data, Government support for private school is growing at twice the rate of public schools’ support.  This, however, is only true if you focus on the last 6 years.  The complete opposite trend was true for the 5 years prior. While MySchool data is only available since 2009, the Productivity Commission’s Report on Government Services goes further back and shows a different trend over an extended timeline¹.

Growth in backing 2 by 5 yearsThe report’s major strength is that it compares a finer slice of the community, focusing on schools with similar socio-economic backgrounds. This removes the effect of funding allocations based on need, which the government currently follows. Seeing as public schools disproportionately service poorer areas, using PC’s rough average (as I did) overestimates the difference in funding as the population serviced by private schools is generally cheaper to support. Unfortunately, the complete MySchool data is not easily available online, so my analysis is restricted to aggregate data and misses this finer level investigation.

However, while I suspect the difference is smaller than that suggested by the PC analysis above, the trend over the 11 years is likely to be the same.

Surprisingly, it’s not only Federal Governments whose support increased faster for private schools over the past 6 years.  State Governments increased private schools funding at 2.6 times the public schools’ rate between 2009 and 2014, with all but NSW and SA increasing support for private faster than for public over that period.  Northern Territory’s private school support grew at almost twice the rate of their public school support.

Growth in backing by sector

Growth in Federal Government’s support has been relatively even over the same period, with private schools funding growing 18% faster than public.

Growth in backing

(N.B.: All analysis is conducted on figures adjusted for inflation.)

The main reason for private schools outpacing public schools is that Federal Govs have increased school funding faster than State Govs.  Over the 6 years in question, State Government funding on average increased by a miserly 4%, while Federal Governments increased education support by 25%.  As Federal support private education more than they do public (as a base rule), their increase ends up largely in private coffers.  Even if Federal grants increased equally across both sectors of education, private schools would win.

This does not excuse the recent growing support for private school funding, but suggests that perhaps our current funding models are too complex and compartmentalised to understand how each lever impacts individuals and/or the entire system. We have too many jars, and too many types of cookies in them. Whether on purpose or misfortune, this often leads to undesired results, like the examples mentioned in the Private school, public cost report, where some private schools receive more funding than their neighbouring public educators.

As long as private schooling is legal, governments need to ensure they are adequately funded and this means continue funding for private education. However, the upper echelons of private education should not be taking resources away from those who need it most.

Education policies should be about more than funding, i.e. how the funding will be used, but perhaps there is room for one overarching policy, not about how much funding will be allocated, but how the cookie factory will be better and more equitably managed


[1] Following “Private school, public cost” methodology, public funding is multiplied by 0.85 to remove User Cost of Capital.

It’s not the size of your budget, but how you use it that counts.

It’s not the size of your budget, but how you use it that counts.

Education policy discussions focus almost exclusively on funding, and this election carries the stench of a pissing competition. However, based on OECD PISA findings there is no link between spending and outcomes, and more so, increased funding over the past 10 years has not shown improvements in student achievements¹.

Even if this weren’t the case, Australia is already among the top spenders in the world, with continuous funding growth going back decades.

School funding appears to only improve achievement up to the point where US $50,000 (ppp) is spent per student over the course of their schooling. Beyond this amount, spending does not seem to improve outcomes. Australia already spends double this amount, and is only surpassed by six countries. Of these six, only Switzerland performed better in PISA 2012.

(The following graphs are sourced from the OECD’s PISA:  
What Makes Schools Successful? Resources, Policies and Practices – Volume IV Publication)

PISA Spending

Much like Australia, most OECD countries increased expenditure in education in the period 2003 to 2012, yet the majority did not find improvements in student outcomes, with many (including Australia) going backwards.

PISA Spending increased

So perhaps it’s time we elevate the conversation from “my education budget is bigger than yours” to “this is how we’ll improve education outcomes, and here is all the research which makes us confident it’s the best way to invest the public purse”.

The current discourse gives the impression that education is under constant attack. However, school funding is ever increasing.  Public schools receive around 15% more per student now than they did 10 years ago (adjusted for inflation). Taking a historical view, public schools are now funded at twice the rate they were in the mid-90s and four times the rate of the mid-70s².

This is not to say that funding doesn’t need fixing, but I doubt it’s a case of needing more, rather better investment and distribution; for decisions to be made based on evidence, not political persuasion.

“What do we want?”

“Evidence based policies!!!”

“When do want them?”

“When they are good and ready, and the research is robust.”


[1] https://www.oecd.org/pisa/keyfindings/pisa-2012-results-volume-IV.pdf

[2] http://www.abs.gov.au/Ausstats/abs@.nsf/0/A75909A2108CECAACA2569DE002539FB?Open & http://www.pc.gov.au/research/ongoing/report-on-government-services/2016/childcare-education-and-training/school-education & http://www.abs.gov.au/ausstats/abs@.nsf/mf/6401.0

How Aus $ affects Aus votes

How Aus $ affects Aus votes

There is no correlation between an electorate’s socio-economic standing and its preferred political party, at least not in the 2013 elections.

The simplistic view of politics suggests one party proposes policies which help poor people and the other party angles to improve the lives of those more fortunate. Yet, in Australia, the socio-economic make-up of an electorate is a very poor predictor of which party will be voted in, at least not nation-wide. It seems Labor electorates are not the working class suburbs usually portrayed, and Liberal electorates aren’t the prime real estate so often generalised.

This is clearly seen when focusing on the top 10 Liberal/National coalition seats.

Top 10 Liberal Seats

As the graph above shows, the ‘rich’ are grossly under-represented in the top 3 ‘liberal/national’ seats, and in three more of the safest Liberal seats.  On the other hand, they are hugely overrepresented in the other 4 of the top 10 seats (averaging 85% of each overrepresented electorate).  As an example, Mallee, on the NSW/Victorian border, has the highest Liberal vote, yet over 50% of the population falls in the bottom 30%, and only 6% are considered in the top 30% of Australia.

The graph below examines the link across all the electorates, by mapping the Labor 2-party preferred vote to the percentage of the electorate which falls in the bottom 30% of the socio-economic spectrum. (It’s a mess!)

Link Labour SEIFA

Similarly, there appears to be no relationship between party allegiance and private schooling.  For all the apparent willingness of the Liberal party to support private schools, areas with a high percentage of kids attending private school are just as likely to vote blue as they are red.

Liberal Private schools

While it seems there is no link between ‘class’ and politics Australia wide, a relationship does exist within capital cities.  Filtering out electorates which have less than two-thirds of its population within a capital city (using ABS’s remoteness divisions), a correlation of 0.51 appears between the Labor vote and areas with high proportions of low socio-economic households.  This means that the larger the percentage of ‘lower class’ households in an electorate, the more likely Labor is to win the seat.  Similarly, the more rich households there are in a city electorate, the more likely the Liberal Party is to win.

(Graph slightly less messy.)

Link in Cities

No such link appears to occur outside of the major cities, neither in regional cities nor in rural areas.

So, are parties not catering to one side over the other, or are constituents unable to discern how each party’s policies will affect them, or do people not vote based on what may benefit them? Or is politics a whole lot more complicated than that?


______________________________


Sources

Voting from Australian Electorate Commission http://results.aec.gov.au/17496/Website/HouseDownloadsMenu-17496-csv.htm

Socio-economic and School attendance from ABS, Census Statistics.

http://www.abs.gov.au/websitedbs/censushome.nsf/home/Census?opendocument&ref=topBar

Funding a safety net for private education

Funding a safety net for private education

Private education allows parents to segregate their offspring based on various socio-economic boundaries.  It limits kids’ socialisation across the wider community, and diminishes awareness of how others live. I don’t believe private schools help create a better society, and it should cease to be a legitimate option.

However, while parents are allowed to send their kids to private schools, it is the government’s responsibility to ensure these are adequately funded to provide a standard level of education.

I usually sit on the anti-paternalistic side of the fence, but I also don’t believe children should suffer due to their parents’ bad decisions. So, much like enforcing vaccination, I think the Government should support private schools to provide decent education.

It may surprise many to know that Australian private schools have less money per student than Government schools ($15,500¹ vs $16,177 in 2012-13²).

While funding for Government schools is relatively evenly spread³, private school funding ranges widely depending on the school and its community.
When picturing private schools, many imagine the top echelons of elitism.  Pompously dressed kids hopscotching their way to Scotch College, Xavier or Sydney/Geelong/Brisbane Grammar.  These do possess much higher budgets than public schools, and should potentially lose all subsidies.  But for every Scotch kid sipping their single-origin soy-latte for morning-tea there are numerous Penola Catholic College and St Bishoy Coptic Orthodox College students boiling their International Roast.  These less famous private schools make up the majority of the private student population.

In 2012-134, the average private contribution to non-government schools was $6,574 per student.  Unfortunately, the MySchool website does not facilitate broad research as not all information is easily available in one dataset5 (figures have to be searched one school at a time), so studies on this is difficult.  However, by cherry picking some obvious cases, private contributions (fees, charges, parental contributions and other private sources)  range from $1.5k to $37.3k (Our Lady of the Sacred Heart Thamarrurr Catholic College NT and Sydney Grammar School being the examples). Seeing as the average is just under $7k, there must be way more schools like Thamarrurr’s than Grammar schools (in funding terms). Without government funding, the majority of private schools would have less than half the $ per student that state schools have.

School funding by decile

While the likelihood of attending a private school increases with socio-economic standing, 22% of students from the lowest socio-economic decile attended a private school based on 2011 Census data.  And over a third of “middle class” students (deciles 4 to 7) attended these schools too6.

While attending private schooling is a choice, it’s usually (I assume, don’t have the figures here) a choice made by the parents, not the kids. Kids whose parents make bad decisions probably already suffer enough through other means. At least their schools should be adequately funded.

Private school fees can be exorbitant, but most people aren’t aware of the amounts spent on public education, so the fees we hear about are hard to contextualise or compare.

In 2013-14 Australian Governments provided $16,177 per student to public schools.  This funding was also topped up by parental contributions and other private sources. While fees and extra funding in public schools may not be as much as private school fees on average, they can amount to considerable figures.  One example found by searching in wealthy areas is that of Auburn State High School, in the Western Suburbs of Melbourne7, which accumulated over $4,000 per student from private sources.

{As an aside, the examples above show how public schools in wealthy areas (e.g. Auburn) have greater private funding (on top of greater government funding) than some private schools (e.g. Thamarrurr in the NT).} 

By sending their kids to private schools, parents default on ‘full government assistance’. Government contributions to private schools bring the average funding up to almost public school levels.  The current federal government funding model for private schools takes into account the socio-economic situation of the students’ families. Schools with high socio-economic students receive as little as 30% of a “full government funded student”, and schools with low socio-economic student receive as much as 70%.  It could be argued that the current funding model is not targeted enough.  Rich schools should receive 0%, and poor ones closer to 100%.

Having said all that, this is trying to deal with a sub-optimal situation.  Better still would be to remove the possibility of kids attending such establishments, and ensuring all students get the education they need, without segregation by religion, social standing, or any other way in which you want to cut society.


[1] Derived from https://www.aisnsw.edu.au/Publications/Other/Documents/ISCA%20Snapshot%202015.pdf & http://www.ncec.catholic.edu.au/resources/publications/353-2013-annual-report/file

[2] Latest comparisons freely available.

[3] Funding for schools differs according to the needs of the students attending, but the range is a lot smaller than private school funding.

[4] Latest freely available.

[5] Despite Federal Government having a policy of “open data by default”.

[6] This analysis uses the SEIFA Index of Relative Socio-economic Advantage and Disadvantage (IRSAD).

[6] This might be the topic for another post.

Tassie’s brain haemorrhage

Tassie’s brain haemorrhage

For many, university represent freedom – intellectually, socially and economically. Tertiary education can stretch our horizons, taking us to places beyond. For Tasmanians, it seems, University often takes you off the island.

This is beyond a brain drain.
In 2013, 14% of all Australian university applications were for an interstate or international university. Tasmanians, however, appeared decisively keener to move, with 43% of their applications being for universities beyond their borders.

Tassie Interstate Uni Applications 1

Tasmanians were also more likely to go through with their intentions. While interstate offers are only accepted 40% of time (Australia wide), Tasmanians’ acceptance rate of 62% is by far the highest of all states.

Tassie Interstate Uni Offers1

The end result: 24% of Tasmanians heading off to university start by boarding a boat (or plane). In comparison, 7% of non-Tasmanians leave their state to attend university.

Tassie Interstate Uni moves 1

Maybe it’s time for the University of Tasmania to revamp their advertising campaign.


You son of a migrant!

You son of a migrant!

Over the course of the 20th century Australia experienced a remarkable increase in high school graduation rates.  This has been relatively stable for almost two decades at 74%, but is it evenly spread across the community?


One interesting variable impacting education attainment is immigration status.  It is not surprising that when designing an obstacle course for foreigners to jump through in order to be granted visas, the immigration department would include an education hoop.  As such, the fact that migrants have higher rates of high-school completion than the local variety is to be expected.
The extent of this effect is somewhat dependant on which corner of the globe the migrants arrive from, but all regions result in higher rates than those born in Australia*.
  
The data herein refers to people aged 20 to 29, to focus on the more current situation, while also reducing the impact of the change over time while also being mindful the rates have been stable since the mid 1990s.
* Regions grouped by the Standard Australian Classification of Countries( SACC)2011: http://abs.gov.au/ausstats/abs@.nsf/mf/1269.0
Interestingly, however, this effect endures beyond the first generation.  According to Census 2011 data, people born in Australia to two migrant parents are 18% more likely to complete high school than Australians with non-migrant parents.  Those with one migrant parent are 8% more likely (this appears to be the case regardless of whether the migrant is the mother or father).
Unfortunately the Census does not provide information beyond the previous generation, so we can’t (from this source) examine how long the migrancy influence is felt for.  
 
Come November, data on tertiary education will become available, allowing for much greater analysis of such topics. More to come.
 ___________
All data presented in this post was sourced from the Australian Bureau of Statistics’ 2011 Census: http://abs.gov.au/websitedbs/censushome.nsf/home/Census?opendocument#from-banner=GT


Sex education

Sex education

Gender inequality, with regards to high school graduation rates, has not been this pronounced since pre WWII days.
 
According to Census 2011 data, boys born prior to 1959 were more likely to finish high school than girls, but the reverse has been the case from that year onwards.  The gap continued to increase for 20 years before steadying.  However, after a small bump in recent years the gap between the graduation rates mirrors the levels seen in the mid 1930s, with girls out-graduating boys by 10 percentage points*.
 
But let’s not get caught in the detail. The greater story is the educational revolution which has occurred over the past 80 years, in Australia and around the world.  While less than 20% of the community finished high school a mere 2 or 3 generations ago (less than 1 in 7 for girls), around 75% of today’s kids do so.   
Graph stops in 1992 as those born since have not had an equal opportunity to graduate yet.
 
Unfortunately, we seem to have plateaued. The fast growth in graduation experienced between those born in 1915 to those born in 1975 has come to a complete halt. The last 17 years have shown no significant movement, with those born in 1975 being just as likely to graduate as those born in the 90s.  Have we peaked? Or is this purely a revolutionary intermission?
 
And is 75% enough?
 
A similar halt to action occurred for boys born between 1955 and 1966, where for a period of over 10 years the rates of graduation did not improve.  That time, however, the effect was only felt by boys, while in the same period girls improved by 12 percentage points.  What was it about the 1970s that didn’t encourage boys to improve their likelihood to graduate from school?  I have no idea, if anyone does, please let me know!
 
This story is not meant to suggest boys are hard done by, but rather to promote the overall improvements in access to education, in particular with regards to gender equality. To highlight one of the many improvements achieved in an impressive time frame  As well as to highlight that it was not so long ago that many of the things many take for granted nowadays were only afforded to a very privileged few.
 
 
* While girls’ graduation rates are currently 10% points higher than boys’, the same 10 points back in the 1930s (because of the small overall graduation rates) meant  boys were almost twice as likely to graduate as girls… oils ain’t oils.

All data presented in this post was sourced from the Australian Bureau of Statistics’ 2011 Census: http://abs.gov.au/websitedbs/censushome.nsf/home/Census?opendocument#from-banner=GT