Helping all – UK’s distribution of public funding

Helping all – UK’s distribution of public funding

Redistribution of funds through tax can happen in one of two main ways:

  • you collect more from the rich than the poor and give everyone an equal share, or
  • you collect the same amount from everyone and distribute more to those in most need.

Gov Exp 1


But how much is the UK doing of either?

In short, relatively nothing on the first type of distribution, and not a lot on the second.

I say relatively nothing as households across the UK pay roughly the same percentage of their income on tax, no matter what their income. Obviously, those with higher incomes pay larger amounts, but as a proportion, it is not greater than what the poor pay.

On the second type, while the Government does provide greater benefits to the poorer sections of the community, the difference between benefits to the poor and rich is not way near as large as many would have you believe.


Collecting more from the rich

As discussed in a previous post, the amount of tax paid across the community is pretty much the same, relative to their income. So, while the rich contribute the most, they contribute the same percentage of their income that the poor do (when including income tax and indirect taxes).


Are we distributing more to the poor?

According to the latest UK Budget papers, the UK Government will spend roughly “£772 billion in 2016-17”[1].

The budget gets spent as follows:

  • £517 (67%) on services consumed by individuals, e.g. health, education, social security
  • £168 (22%) on untargeted national stuff, e.g. defence, paying debts, public order
  • £87 (11%) on services which may or may not support some over others, but it’s harder to ascertain its distribution, e.g. agriculture, industry, employment, transport

For the purposes of this post, I will ignore the 11%, as I can’t find reasonable distribution analysis, and what’s 11% anyway.

Gov Exp 11

So, how do targeted services get dispersed across the income groups?

Health

Health accounts for 19% of all UK Government expenditure, with the average household in 2013/14 consuming around £4,200 in services.  While obviously not every household consumes the same amount, the difference across income groups is surprisingly small.

Gov Exp 2

That’s to say, households from across the various income groups in the UK consume just over £4,000 worth of health services. Those with the lowest and highest incomes appear to consume slightly smaller amounts.


Education

Consumption of education services does vary. In 2013/14, the poorest 3 deciles consumed just over double what the richest 10% of households did.  This difference, however, appears to be largely driven by the number of students in the house, rather than their income.  Students (from primary school to university) are twice more likely to live in the poorest 30% of households than in the richest 10%.  After adjusting for number of students per household, education expenditure is remarkably similar across the income ranges.

Gov Exp 3

(As student estimates are rounded to 1 decimal place, the estimates graphed include an unrounded range, e.g.: the poorest households have 0.7 students per house, but are graphed from 0.65 to 0.75)


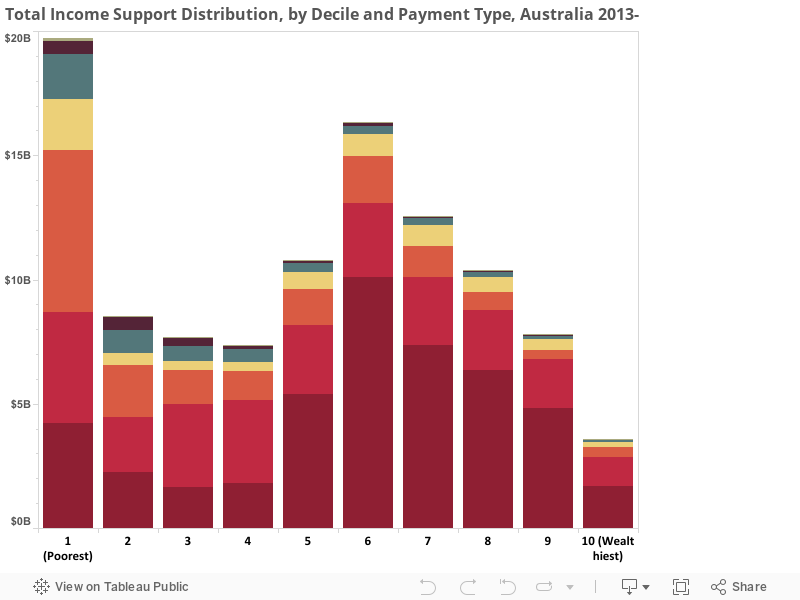
Social Protection & Personal social services

Unlike health and education, social protection and personal services are targeted based on income. But even these payments are possibly less lopsided than is expected.

The poorest half of the community receives 80% more than the bottom half. While the average household receives £6,000, the 2nd and 3rd poorest received the most, at £9,000. The richest and second richest deciles, on the other hand, received £2,400 and £3,500 per year respectively.

Gov Exp 35


When you add it all up

Other than social security, which is mostly targeted at the lower middle class, the majority of government spending is spread out quite evenly across the income groups. The end product, being one that while leaning towards supporting the lower middle class, provides a relatively equal distribution.

Gov Exp 4

*not including 11% spent on Agriculture, Transport, Industries, etc.


Sources

[1] https://www.gov.uk/government/publications/budget-2016-documents/budget-2016

http://www.ons.gov.uk/peoplepopulationandcommunity/personalandhouseholdfinances/incomeandwealth/datalist?filter=datasets

Parliament photo by : luxstorm – https://pixabay.com/en/users/luxstorm-1216826/

UK auto disqualified after poor lifting

UK auto disqualified after poor lifting

In the aftermath of Brexit, the pointy finger of blame has fallen squarely on the rise of conservative patriotism, racism and the stench of economic stagnation among the working poor.

But when analysing the economic situation of UK’s households over the last few decades, it’s hard to see what Brexiters are complaining about.

While American working class wages got stuck in the 1970s, the UK’s have been rising steadily, especially since 1990. In fact since Thatcher lost office, the poorest 40% of households have seen their disposable income increase at twice the rate of the rest of the country.

PoorPoms1

(I use disposable income as it’s a more complete measure of a household’s situation than wages.  It includes all income (private and government cash benefits) and removes direct taxes (income tax).  It’s the money which lands in people’s pockets.)

After adjusting for inflation, household disposable income grew by 71% for the poorest 20% of households, and 59% for the 2nd poorest since 1990.  The rest of the UK only grew by 34%.

The poor are not only getting richer in absolute terms, but also in relative terms.

PoorPoms2

Firstly, absolute growth

The poorest quintile has seen their disposable income increase from £7,200 in 1990 to £12,300 in 2014/15 (after inflation). The second poorest quintile increased from £12,400 to £19,800. No matter how hard life is today for poor households, it would be a lot worse with £6,000 less a year.

To put this growth in perspective, we can compare today’s poor households to that of people in the past.  Today’s 2nd poorest quintile earns the same as the middle quintile earned in 1990. And going back a bit further, they earn the same that the 2nd richest quintile did in 1977, just before Thatcher took office. So, the economic situation of the working class today is similar to that of the upper middle classes when the (Royal variety) Queen celebrated her Silver Jubilee, and Queen (of the Freddy Mercury variety) released “We are the champions”.


Secondly, relative growth

As the poor households’ earnings grew faster than the rich ones, the relative gap has decreases considerably. The disposable income ratio of richest to poorest was 7 at the end of the Iron Lady’s regime. Today that figure is 5.4. Likewise, the ratio between the 2nd richest and 2nd poorest quintiles dropped from 2.4 times to 2.0. Of course, the ratio is still too large, but a 23% drop is worth noting.


Since GFC

The figures above look at the UK since the departure of Lady Thatcher in 1990, but what about a more recent focus?

Well, the picture is even rosier (relatively speaking) for the lowest quintile over the past 7 years.  While the richest 2 quintiles dipped between 5-10% around 2011-12, and have only just returned to pre-crisis levels, the poorest quintile now earns 11% more than they did in 2007/08, and never went behind pre-crisis levels over the period.  The 2nd lowest earners hovered steadily, but over the past 2 years increased to a small increase over pre-crisis levels.

PoorPoms3

A historical lens

A longer search shows that this was not always the case. The last dark age for the lower classes was clearly under Thatcher.  During Margaret’s 11 year regime, the disparity between rich and poor climbed steeply.  While the richest households in the UK experienced a 46% increase in real disposable income, the poorest 2 quintiles only increased by 11 and 13%. This resulted in the income ratio of richest to poorest to rise from 4.9 to 7 in an 11 year period.

PoorPoms4

It’s taken the following 25 years to bring this disparity back to pre-Thatcher levels for 2nd richest to 2nd poorest, but the Richest to poorest ratio is still much higher than it was in the late 70s.

PoorPoms5

Show me the money

Here’s where it gets super interesting. It would be easy to assume that seeing as the end of Thatcherism marked the turning point for income distribution; government handouts would be somewhat responsible for the change. But that is far from the truth. The income growth for the poorest has been largely driven by increases in private income. Since 1990, private income for the poorest has increased by 168%, while Government support only increased 22%! The opposite was surprisingly true under Thatcher, when the bulk of the poor’s income increases came from government benefits.

PoorPoms6

Since 1990, Government support has increased the least for the poorest quintile, in relative AND absolute terms.  While the government now gives the poorest quintile £1,400 more than they did in 1990 (after inflation), they also give middle income earners an extra £3,400, and the richest quintile an extra £1,700 per year, after inflation.

PoorPoms7

Brexit due to a lack of jobs available

Yeah, nah. Unemployment has not been lower than current rates since the mid-70s. Sure there was a momentary blip from the 2008 crisis, but not only did that not reach the unemployment levels seen in the 80s and 90s, it also finished a year ago. People should be high on finding employment at the moment.
PoorPoms8

It’s not you, it’s tax

Even income tax hasn’t been lower in the last 40 years. The poorest households now pay 5 percentage points less in tax than they did 25 years ago, and the middle and upper middle classes have dropped around 3 percentage points. The only section of the community paying more tax (per household) are the richest 20%, and even they only pay less than 1 percentage point more than they used to.

PoorPoms9

So, what the heck are Brexiters complaining about?

Overall the economic situation in the UK has been favourable across the community, and in particular the poorest sections.

  • Income is considerably up
  • Inequality is slightly down
  • Unemployment is at its lowest point in the last 40 years, and
  • Brits have not paid less in taxes in at least 40 years.

Furthermore, the government is increasingly supporting the middle and upper classes through direct cash benefits, so they can hardly complain about the support being handed out to those (arguably) more deserving.

What’s that leave us with

If Brexit was a vote of discontent at the current economic situation, it was a result of perception more than reality. More likely, it was a vote from fear. A xenophobic reaction to the constant hysteria bombarded at the populous, misleading on the current situation. The world is not getting worse. Neither from within, economically, nor from outside evils.

Time for more reasoned responses, from a better informed community.


Sources

All data is sourced from the Office of National Statistics (ONS) UK.

http://www.ons.gov.uk/peoplepopulationandcommunity/personalandhouseholdfinances/incomeandwealth/bulletins/householddisposableincomeandinequality/financialyearending2015

http://www.ons.gov.uk/employmentandlabourmarket/peoplenotinwork/unemployment/timeseries/mgsx/lms

Wealthy fare well from welfare

Wealthy fare well from welfare

In 2013-14, the Australian Government dispersed a Robin Hoodesque $105 billion across the community through income support payments. That’s roughly 30% of its tax revenue. Unlike Robin, however, Kevin, Julia, Tony and their merry men gave much of their loot to the most fortunate, rather than to the poor.

Based on research conducted by the Australian Productivity Commission[1], the wealthiest half of households received just as much income support as the poorest half.  And whilst the poorest decile (10%) received the most support, those in middle upper wealth households (50th to 80th percentile) received the lion’s share.

The distribution of government support to wealthy households is largely driven by Aged and Family pensions, whilst Unemployment, Study and Disability payments go some way to balancing out the situation.

Newstart allowance (a.k.a. the dole) and Study Support programs are tightly targeted based on income and wealth of the recipient. Disability payments are also largely provided to less wealthy households. This leads to claims that the Australian Welfare system is one of the most targeted in the world.

Income Support - Dole and Study

However these two payments only make up 7% of all income support provided by the government.

The majority of the loot is given away in the form of Aged Pensions (44%) and Family Payments (26%).

Income support by payment

Unlike the dole, Aged Pensions and Family Payments are much looser in their targeting.  As a result, more of these benefits are paid to the top wealth brackets than to the poorer households.

Income Support - Pensions

Unfortunately, this appear to create an entirely misguided system in which the wealthiest households in Australia receive more welfare than those with limited resources, to the extent that the amount paid in Aged Pensions to the top 20% of households is $1.2 billion more than the entire unemployment benefits.


This is not to suggest that pension need cutting, nor that the Australian welfare system is over-inflated.

Rather that we’re failing to funnel funds to support those in the greatest need.

____________________________________________

[1] Productivity Commission – Tax and Transfer Research

[2] Image credit: hktang – Flickr – / CC BY – Modified