They don’t make rates like they used to

Australian mortgage affordability has not changed in over 20 years.
This statement needs a pinch of caveats and a blanket of context, but when all is said and done housing costs have been surprisingly steady.
I didn’t want to write about housing affordability so soon after we checked our privilege, but a Fitzsimmons article in the Sydney Morning Herald piqued my interest. In it, Fitzsimmons focuses on two key affordability ingredients: interest rates and house prices, concluding that “younger Australians definitely have it tougher when it comes to housing affordability”.
There are many ways of measuring housing affordability, but I find Fitzimmons’ measure of choice to be more relevant than most. What proportion of a household’s income is spent on mortgage repayments. According to the article, in the late 80s and early 90s:
“When interest rates were 17 per cent, the proportion of household disposable income that went on the interest payments for the home loan was 6.1 per cent. It’s currently 6.8 per cent.”
These figures metaphorically killed my cat. If interest repayments are below 7%, then why all the commotion?
I believe the article is wrong about the figures, but nailed their consistency.

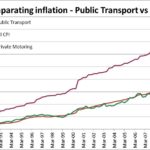
(Data sources for graph in notes below.)
According to data from the Australian Bureau of Statistics, households spent around 24% of their disposable income, on average, on mortgage repayments in 2010. Over half of which went to paying off the interests alone. Mortgage costs as a percentage of gross household income (I’ll use gross instead of disposable from here-on-in as it’s more readily available) have been steady since at least 1993, bouncing between 19% and 23%. Some of this fluctuation may even be ‘margin of error’ as the figures are roughly +/- 2%. So servicing mortgages now appears at worst as affordable as back in the 90s and 2000s. At best about 4 percentage points lower than in the mid-90s. Repayments were a little smaller in the 80s but the difference is not as big as I expected (15% in 1984 and 18% in 1988-89). Some of this difference is also cushioned by decreasing costs of related items such as furniture and household equipment, which has halved in relative cost compared to 1984 (down from 6% of household income to 3%).
Also, while the outlay in the 80s was smaller, a larger proportion of the repayments were spent covering the interest rather than going towards decreasing the debt.

What about outside of our beautiful borders?
Affordability seems to me more relative than absolute. Australian mortgages may not have changed much in the last decades, but how do we compare to other countries? Lacking an internationally recognised standard for such a measure I was only able to research other rich English speaking countries (my French, Arabic and Chinese aren’t quite up to scratch). And from what I gathered, repayments here are comparable to those in Canada, UK, USA and NZ.

None of this talks about people’s difficulty in breaking into the market, nor how hard it is for low income families to afford a home of their own. But it does suggest that Average Aussie Anne’s situation is not special. Housing has been at similar levels for a while, and it is also at similar levels in other similar countries. So, either the level of affordability is fine, or it’s equally un-affordable elsewhere/else-time.
Also, if the situation is so similar in other countries which have very different taxation systems, with or without such policies like Capital Gains, Negative gearing, and building controls, then ‘solving’ this may not be as easy as some suggest.
Sources
- The Graph 1 is made from 2 different sources:
- The Household Expenditure Survey, detailing Interest and Principal Payments separately.
- The Housing Occupancy and Costs Survey which only provides a total amount. This survey only has “housing costs”, which also includes rates, etc. To account for this, estimates for non-mortgage costs are derived by subtracting the value of “Owner without a mortgage” from “Owner with a mortgage”. It isn’t perfect, but I believe it accurate enough for this purposes.
- Australian data:
http://www.abs.gov.au/AUSSTATS/abs@.nsf/DetailsPage/6530.02009-10?OpenDocument (various years)
http://www.abs.gov.au/ausstats/abs@.nsf/PrimaryMainFeatures/4130.0?OpenDocument - USA:
https://www.census.gov/programs-surveys/ahs/data/interactive/ahstablecreator.html#?s_areas=a00000&s_year=n2011&s_tableName=Table10&s_byGroup1=a7&s_byGroup2=a1&s_filterGroup1=t2&s_filterGroup2=g1https://www.census.gov/programs-surveys/ahs/data/2005/ahs-2005-summary-tables/h150-05.html - UK:
https://www.ons.gov.uk/peoplepopulationandcommunity/personalandhouseholdfinances/incomeandwealth/compendium/familyspending/2015/chapter4trendsinhouseholdexpenditureovertime
https://www.ons.gov.uk/peoplepopulationandcommunity/personalandhouseholdfinances/incomeandwealth/compendium/familyspending/2015/chapter2housingexpenditure - NZ:
http://www.stats.govt.nz/browse_for_stats/people_and_communities/Households/HouseholdExpenditureStatistics_HOTPYeJun16.aspx - Canada:
http://www5.statcan.gc.ca/cansim/a47
http://www12.statcan.gc.ca/nhs-enm/2011/as-sa/99-014-x/2011002/tbl/tbl03-eng.cfm