Smoking the poor

Smoking the poor

Australia’s 2016-17 budget announcement included “four annual 12.5 per cent increases in tobacco excise and excise equivalent customs duties”, claiming it will raise “$4.7bn over the next four years”.¹

This is unlikely to face much opposition. After all, taxing smoking aims to discourage the leading cause of preventable deaths in Australia².

But it’s interesting to see who will be most impacted by this, as smoking is a poor person’s game.

Based on 2009-10 household expenditure data³, increasing the cost of smoking will have a much larger impact on the poorest sectors of the community than anyone else.  More specifically, it will impact households receiving unemployment, disability, and carers payments – those already under the most amount of financial strain.

Smoking poor

Back in 2010, the poorest 20% of households were already spending four times as much of their weekly expenditure as the richest 20%.  Households whose main source of income was unemployment benefits spent three and half times the national average on tobacco, in relation to their total income.  Those whose main income was disability and carer payments spent three times the national average.

This is likely to be much more accentuated today as the 25% annual increase in tobacco excise since 2010 has almost doubled the price of cigarettes since that data was produced[4].

So how will this picture look in 4 years’ time, after 8 years of tobacco increases, when a packet of winnie blues cost $50?

Smoking is addictive. I suspect it’s easier to sell a house than quit smoking. Yet, when governments change legislation, making previous decisions less financially desirable, there’s usually talk of ‘grandfathering’ policies. That is to say that if we ever change capital gains policies we’ll ensure those who got in on the action prior to the changes don’t lose out.  Should similar considerations be made with smokers? Or is this more like the drug dealer who gives away the first few hits until you’re hooked, and then jacks up the prices, marginalising the destitute to a life of crime, imprisonment and social isolation?

I suspect it’s not all bad. Many will quit, thus improving their lives, and those of their loved ones. But for those unable to let go of nicotine’s vice, I suspect health issues will be only part of their worries.


[1] http://www.budget.gov.au/2016-17/content/glossies/tax_super/html/tax_super-05.htm#health

[2] http://www.quit.org.au/resource-centre/facts-evidence/the-big-kill

[3] http://www.abs.gov.au/AUSSTATS/abs@.nsf/Lookup/6530.0Main+Features12009-10?OpenDocument

[4] http://www.tobaccoinaustralia.org.au/13-3-the-price-of-tobacco-products-in-australia

A tale of two culinary cities

A tale of two culinary cities

Food and its enjoyment might be a very personal and subjective thing, but Australians are obsessed with quantifying it.

Today was the Australian Financial Review’s turn to put out a list of Australia’s top 100 restaurants. This one has the distinction of being voted on by ‘top’ chefs and restaurateurs.

And if these experts are to be believed, it seems hard to get a decent meal outside of Melbourne and Sydney.  77 of the top 100 restaurants are based in Australia’s biggest cities, with a further six in country NSW and Victoria. This leaves only 17 restaurants across the rest of Australia.

The spread is even worst when focusing on the highest echelons, with Tasmania the only ‘outsider’ to place in the top 40!

Top 100 restauratns pyramid

Brisbane, Australia’s third largest city fared the worst. Only two of its restaurants landed in the top 100, placing 64th and 78th.  Hobart, a quarter of Brisbane’s size, punched way above its weight, also with 2 placings (10th and 86th).

I have eaten at 14 of the listed restaurants and in my opinion they’re very much hit and miss: MoVida and St Crispin stand out, but Bar Lourinhã and Cutler & Co are terribly overrated.

Top 100 restauratns zomato

The eating and judging masses also appear ambivalent about the choices.   The top 100 restaurants score between 3.2 and 4.9 (out of 5) on Zomato, with an average score of 3.9.  This is not a terrible score, but hardly seems top restaurant material.

So, while I don’t find such lists helpful in choosing a spot for a Friday night bite, they do show how geographically lopsided opinions are.

Brisbane’s culinary scene may have been transformed since I left there almost 10 years ago.  Not only in the usual spots like New Farm, Paddington and West End, but also more suburban areas like Graceville are sprouting delicious eateries (e.g. Boucher French Bistro).

Still, the reputational status quo remains, and conservative lists like this probably don’t help.


Total List Table

Top 100 restauratns table

De-constructing the ‘g’ gap

De-constructing the ‘g’ gap

Last week was International Women’s Day so everyone should be up to date with the latest estimate of the gender pay gap (17%), and very well versed on at least three theories behind it.

Now, then, might be the perfect time to ask why the social progress and workforce changes which occurred over the last 30 years have had no impact on the gap.

The increasing awareness, numerous policies, university attendance explosion, increasing maternity leave and participation rates, industrial and occupational distributions, and a myriad other variables have increased or decreased to varying degrees. Mostly towards gender parity. Yet the pay gap for full-time women has not deviated more than +/- 2 percentage points since Lionel Ritchie first sang “Hello…. is it me you’re looking for?!”[1].

Gender Pay gap 83 15

The gap itself is a complex issue with many moving parts. This is a look at a few of those parts, and a general wondering: how is it not improving?


An aging workforce

One of the biggest changes in the workforce has been workers’ age. Average full-time wages increase rapidly with age, until they begin plateauing around 30, finally peaking in the late 30s to mid 40s (depending on occupation and role).  On average, workers under 25 earn 40% less than those 25 years and over[2].

Historically, one of the reasons behind the wage gap has been that working women are dis-proportionally younger than men, and therefore lower paid (i.e. junior staff on junior wages).  But the age demographic across the sexes has become a lot more equal over the last few decades.

While the overall percentage of workers under 25 has halved since 1983, women’s compositional distribution has changed much more than men’s (as shown by the graph below)[3].

Aging workforce by Sex

This suggests junior wages, or wages from young staff who are yet to reach role maturity, should have a much smaller impact on the overall average wage than it used to. Thus, diminishing one reason why there may be a pay-gap.

On the other end of the maturity spectrum, the proportion of women over 40 has almost doubled since 1983.  This suggests a greater proportion of women are returning to full-time employment after giving birth, continuing to build on their careers, with advanced wages.

Aging workforce by catergories

The changes in women’s labour force have been so substantial that the average age gap between the sexes is less than a quarter of what it used to be: down from 4.5 years in 1983 to 1 year gap in 2015.

This said, women have not achieved age parity in the workforce, but it’s certainly a lot closer than it used to be. Yet, the pay-gap has not changed since ‘Return of the Jedi‘ hit the cinema screens.


Women learning it for themselves

One potential reason behind the maturing female workforce is the increasing number of women attending university.  University attendance has increased across the board, but women’s increase has doubled men’s.  While women had not achieved tertiary education parity by the early 80s, they well and truly have by 2015.  In 2013, 58% of all Australians studying at university are women. This is just as true for postgrads as it is for undergrads. In fact, women have been the majority at uni since 1987[4].

This increase in university attendance has flowed to the labour force.  Full-time working women are now 45% more likely to have graduated from university than their male counterparts.

Uni Attainment in LF by sex

However, not all graduates are created equal. Some fields of study pay more than others, and the figures above don’t provide that level of detail. But overall graduates earn substantially more than workers with no university qualifications, and women are increasingly dominating this sphere.

This further suggests a move towards pay parity.  Yet, the pay-gap has not changed since Bob Hawke first became Prime Minister of Australia.


From doing to managing – occupational changes

Higher paid occupations (e.g. managers and professionals) now make up much larger proportions of the workforce than they did in the mid80s. Whether it’s due to social progress, the growing number of university educated women, or any other reason, the proportion of women in these roles has increased faster than men’s over the period in question.  The proportions of full-time women in the two highest paid occupations, professional and managerial roles, have increased 12 and 6 percentage points respectively. Men, on the other hand, increased 7 and 2 percentage points.

To balance this out, the proportions of women filling admin, labouring and sales roles (the three lowest paid occupations) have decreased by 11, 4 and 3 percentage points, to men’s 2, 4 and 1.

The graph below compares the proportion of women and men by occupation in 2015 to 1986. Higher paid occupations have generally increased, and low paid decreased… and women have faired better at both ends of the spectrum.


Occupation can still account for some of the current disparity. Despite the move towards higher paid roles, women are still over represented in some of the lower paid occupations; e.g. 25% of women fill admin roles, as opposed to 7% of men. But the changes over the past 30 years should have had an impact on the pay disparity.

Yet, the pay gap has not changed since the average price for a Melbourne house was $52,000[5].

Changing occupations by sex2

Mining the AGEING boom

Unlike the other variables examined, women have not clearly moved to the higher paid industries over the past 30 years. In fact, women have slightly decreased proportional representation for the three highest paid industries when compared to men (i.e. mining, financial and professional services). Mining is of particular interest as it is the highest income by almost $40k, and the boom meant its growth outstripped every other industry’s growth. These two aspects combine to help stretch the pay-gap further apart.

Changes in Industry distribution, by sex, 1984 to 2015

Changing industry by sex 3

The industry experiencing the largest increase in women participation has been Health Care and Social Assistance, potentially on the back of Australia’s ageing population’s demand. While its income is only marginally below the average for all industries, the increase in Health and Social assistants means women have not migrated towards the higher paid industries in large numbers.

Having said that, as previously described, women have gained much ground in GP representation.  The proportion of women GPs has increased from 22% in 1984 to 43% in 2014*.  This means that whilst women continue to be over represented in lower paid industries, they are filling higher paid roles within these industries.


Ask for more

Data on workforce by “method of setting pay” (i.e. opportunity to negotiate pay, which some suggest promotes disparity) has been hard to come by. This aspect may be extended upon in future.


Yet, not.

Most of these changes suggest the gender pay gap should have decreased over the past 30 years. At the very least it shows the variability of many contributing aspects. To not have achieved pay parity is understandable, as there are still many obstacles to overcome, and underlying contexts/assumptions/social norms to change. And many tricky issues to figure out on how to get there.

  • Should more women work in higher paid industries, or should we (financially) value women-dominated industries more?
  • Are health and education paid less because they are women heavy industries, or are they women-dominated because they are lower paid?
  • Should we increase paternity leave to support women to stay, or support them to return after birth-giving?
  • Should women be encouraged to negotiate more or should industrial frameworks diminish the impact negotiation has on individual’s pay?

But to not have made any improvement, despite all the changes that have occurred seems odd. Changes in age  alone should have had massive impacts.

Yet, not. No change, improvement or otherwise.

This post has no answers or suggestions… just a baffled look to greater minds to tells us why…


[1] Based on Full-time ordinary wages, by sex from Average Wages, ABS: http://www.abs.gov.au/AUSSTATS/abs@.nsf/DetailsPage/6302.0Nov%202015?OpenDocument

[2] http://www.abs.gov.au/AUSSTATS/abs@.nsf/DetailsPage/6306.0May%202014?OpenDocument

[3] http://www.abs.gov.au/AUSSTATS/abs@.nsf/DetailsPage/6291.0.55.003Nov%202015?OpenDocument

[4] http://docs.education.gov.au/system/files/doc/other/time_series_data_1949_-_2000.pdf and http://highereducationstatistics.education.gov.au/

[5] http://www.econ.mq.edu.au/Econ_docs/research_papers2/2004_research_papers/Abelson_9_04.pdf
 

Australia’s war on what

Australia’s war on what

The incarceration rate in the U.S. is ridiculous, but it wasn’t always like this.

The 1970s kicked-off the ‘tough on crime’ and ‘war on drugs’ period, which has had such an impact that the U.S. now has the highest prisoner rate in the world (discounting Seychelles), and currently stands at over 4 times the OECD average¹. In fact, the U.S.’s willingness to imprison its people is so out of step with the rest of the world that it now hosts almost a quarter of the entire world’s prisoners².

Yet, the incarceration rate of Australia’s Aboriginal and Torres Strait Islander people is more than twice³ the rate of the U.S. … and growing!

The first graph has been doing the rounds for the last couple of years, and shows how the U.S.’s willingness to imprison its population has changed over the last few decades.

The second graph compares the American rate to that of Aboriginal and Torres Strait Islander people in Australia.

How bad is the crime situation in Australia that has lead to this?


[1] http://www.oecd-ilibrary.org/sites/factbook-2010-en/11/04/01/index.html?contentType=%2Fns%2FStatisticalPublication%2C%2Fns%2FChapter&itemId=%2Fcontent%2Fchapter%2Ffactbook-2010-95-en&mimeType=text%2Fhtml&containerItemId=%2Fcontent%2Fchapter%2Ffactbook-2010-95-en&accessItemIds=&_csp_=4f5272543a5f9d2bef941b4101f970ae

[2]  Roy Walmsley (November 21, 2013). World Prison Population List (tenth edition). International Centre for Prison Studies.

[3] Comparisons across international jurisdictions are more complicated.  Generally the ABS figures for rate of imprisonment is based on all people in jail per 100,000 adults. The US figures in the historical data presented here, however, only include ‘prisoners sentenced for 1 year or more’. The graph provided shows comparable data, based on the same variables. The relevant Australian figures for Aboriginal and Torres Strait Islander people are derived using data in Table 10 of ABS’s Prison publication linked below.

U.S. Data for 1925 to1977 from http://www.albany.edu/sourcebook/pdf/section6.pdf

U.S. Data 1978 to 2014 from http://www.bjs.gov/ –  Corrections Statistical Analysis Tool (CSAT) – Prisoners

Australia Data: http://abs.gov.au/AUSSTATS/abs@.nsf/allprimarymainfeatures/8D5807D8074A7A5BCA256A6800811054?opendocument

Prisoner publication 2005 to 2015 – please request derived figures. Planning to have datasets available online in future.


4:  Picture used with CC authority, thanks to: www.flickr.com/photos/marineperez/4698707308

Picture changed to highlight that 1 in 3 people in Australia’s jails are Aboriginal and Torres Strait Islander.

Out of the dog house

Out of the dog house

I’m not sure whether it’s the cute-dog youtubing or an improvement in general humanity, but something is making Australians euthanize a lot less dogs than they used to.

The number of dogs euthanized per year by the RSPCA¹ has dropped by over three quarters since the mid-90s.  Most of that drop happened in the last five years.
RSPCA dogs and cats 1995-2015_ 2

While 6,765 were put down in 2014-15, this is a huge drop from the 33 thousand the RSPCA averaged in the late 90s.  Even up to 2010 there were over 20 thousand dogs euthanized per year.

In rough terms, 70 less dogs are being put down per day, than 20 years ago.

Similarly, cat euthanizations have decreased by 60% over the same period, with almost all of this occurring since 2007.

Some of this drop can be attributed to more pets (particularly cats) being reclaimed or rehomed prior to having to be put down. Back in 1996, the RSPCA killed three out of every 4 cats it came into contact with. That rate has now dropped to 1 in 3.

RSPCA cat outcomes_2


If people keep adopting pets (and other great initiatives), hopefully this trend will continue!


Sources and Links
1 RSPCA Stats:  http://www.rspca.org.au/facts/annual-statistics
Adopt-a-pet:  https://www.adoptapet.com.au Feature Pic: Dog beach afternoons

Tassie’s brain haemorrhage

Tassie’s brain haemorrhage

For many, university represent freedom – intellectually, socially and economically. Tertiary education can stretch our horizons, taking us to places beyond. For Tasmanians, it seems, University often takes you off the island.

This is beyond a brain drain.
In 2013, 14% of all Australian university applications were for an interstate or international university. Tasmanians, however, appeared decisively keener to move, with 43% of their applications being for universities beyond their borders.

Tassie Interstate Uni Applications 1

Tasmanians were also more likely to go through with their intentions. While interstate offers are only accepted 40% of time (Australia wide), Tasmanians’ acceptance rate of 62% is by far the highest of all states.

Tassie Interstate Uni Offers1

The end result: 24% of Tasmanians heading off to university start by boarding a boat (or plane). In comparison, 7% of non-Tasmanians leave their state to attend university.

Tassie Interstate Uni moves 1

Maybe it’s time for the University of Tasmania to revamp their advertising campaign.


Alternative music drowns out the call for change

Alternative music drowns out the call for change

Like many of my generation, I have fabulous memories of Australia Day from my teenage and Uni years.  In fact, I used to claim Australia Day to be my favourite public holiday.

This is in no small part for two reasons:

Since the early 90s, Triple J has been galvanising Australia Day’s place in contemporary culture, providing the youth with strong bonds and fond memories. In fact, Triple J has helped Australia Day seem like the most inclusive day of all: the day in which all it takes to have access to the country’s best musical festival is a radio; and a mobile to have a say.

The day plays perfectly to all Australian clichés: sun, beer, music, mates, and backyard BBQs.

All while turning a blind eye to what the day represents.

For over 20 years, Triple J has been doing the community a disservice. Perhaps unwittingly so, but these positive connotations of the 26th January are distancing an increasingly large section of the community (over 2 million in 2014¹) from recognising the terrible past it represents, and the symbolic weight it still holds for many today.

The devastation of Australia’s Indigenous peoples, which begun with the arrival of the British colonisers on the 26th January 1788, was so severe that roughly 10 times more Indigenous people died by Australian Federation than all Australian casualties in WWI².

Triple J is a wonderful radio station which supports youth and independent music across the community. They support initiatives such as mentoring and unearthing Indigenous artists, as well as the National Indigenous Music Awards. This year the Hottest 100 is also partnering with AIME to “help close the education gap between Indigenous and non-Indigenous Australian students”³.

So, this all begs the question: why do they continue to host their biggest day of the year on a day which commemorates the beginning of a massacre, dispossession, and centuries of legislated racial discrimination which almost destroyed the ‘oldest living cultural history in the world’4?

While it might be difficult to move Australia Day for now, it may help if we stop drowning out the calls for change with the coolest karaoke party ever.

Does the Hottest 100 even need to be on a public holiday?  Is the Hottest 100 Day not enough of a celebration?

Sure, it’d be great to still have it when it’s hot… so how about the third Saturday of January? It even ensures you get an extra day to recover before going back to work!

Let 2016 be the last Triple J Hottest 100 held on the 26th January.

Let 2017’s Hottest 100 be a day we can all celebrate!

#letsmovehottest100day #hottest100


[1] https://en.wikipedia.org/wiki/Triple_J_Hottest_100

[2] https://www.awm.gov.au/atwar/ww1/ & https://en.wikipedia.org/wiki/History_of_Indigenous_Australians

[3] http://www.abc.net.au/triplej/hottest100/15/donate/

[4] http://www.australia.gov.au/about-australia/australian-story/austn-indigenous-cultural-heritage

No cause for celebration

No cause for celebration

With the end of year festivities behind us, those of us fortunate enough to have a job have one thing on our minds… the next public holiday.

Unfortunately our next public holiday is one which comes with mixed feelings. Sure, it’s a day off in the Australian Summer, perfectly timed to enjoy the world’s biggest music democracy, but it is also a reminder that Australia (like many countries) has not faced up to its horrific past.

Most of the 197 countries with a recognised ‘national day’ on Wikipedia¹ celebrate one of the following categories:

  • 143 – Independence from a foreign oppressor or colonial power
  • 22 – Drastic change of governance (e.g. a revolution, becoming a communist nation, or a republic), usually towards its current form
  • 13 – Royalty (e.g. Queen’s birthday, Coronation day)
  • 9 – Unification from previously separate nations, or a separation from a previous group
  • 4 – a religious occasion

Four countries chose a different cause for celebration:

  • Portugal commemorates the death of a famous poet, Luís de Camões (best national day ever!)
  • Spain remembers having colonised an entire continent
  • New Zealand celebrates the Treaty of Waitangi, between the British Crown and Māori chiefs; and
  • 1 country celebrates the day on which a foreign colonial power invaded its land, and started a devastation which led to the death of an estimated 90% of its native population.

Australia – the only country in the world which celebrates having been invaded/ colonised – the day in which another nation’s flag was raised on its soil, (the British Flag in Sydney Cove).

Many momentous occasions have taken place since Australia gained independence in 1901². The combination of these has led to what many of us enjoy today.

Choosing the perfect day will no doubt be a difficult decision. But avoiding one of the worst should be a no-brainer.

Celebrating the beginning of a massacre, dispossession, and centuries of legislated racial discrimination which almost destroyed the ‘oldest living cultural history in the world’³ shows an absolute lack of empathy for humanity, and seems entirely at odds with what one might expect are commonly held beliefs of “modern Australians”.

The devastation of Australia’s first peoples was so severe that over six times more Indigenous people died by Australian Federation than all Australian war casualties in all wars, ever (4).

The Indigenous population is only now reaching pre-colonisation numbers, over two centuries on (5).

Recognising that colonialists were not the national heroes we once painted them to be is not a novel idea. Countries across the American continent (6) have long been moving away from celebrating Columbus Day, which marked Spanish colonisation. Instead focusing on the impact colonisation had on indigenous peoples across the continent, and the work needed to mend interactions.

The 26th January is not a day for BBQs, beers, and country-wide sing-alongs to the year’s best music.

It’s a day of mourning.

Perhaps a day to acknowledge how far we’ve come, and reflect on how far we’ve got to go.


_______________________________________________

[1] https://en.wikipedia.org/wiki/National_Day

[2] http://www.australia.gov.au/about-government/how-government-works/federation

[3] http://www.australia.gov.au/about-australia/australian-story/austn-indigenous-cultural-heritage

[4] https://www.awm.gov.au/encyclopedia/war_casualties/ – All war casualties =  102,815. Indigenous casualties is estimated by the loss of 90% of commonly agreed estimate of 750,000 people pre-invasion

[5] http://www.abs.gov.au/ausstats/abs@.nsf/mf/3238.0.55.001 compared to pre-colonisation estimates

[6] https://en.wikipedia.org/wiki/Columbus_Day

Australians flying off-the-charts

Australians flying off-the-charts

In this age of Cognitive Behavioural Therapy, it seems Australians have coordinated a national group exposure therapy for one of the most common fears… aviophobia.

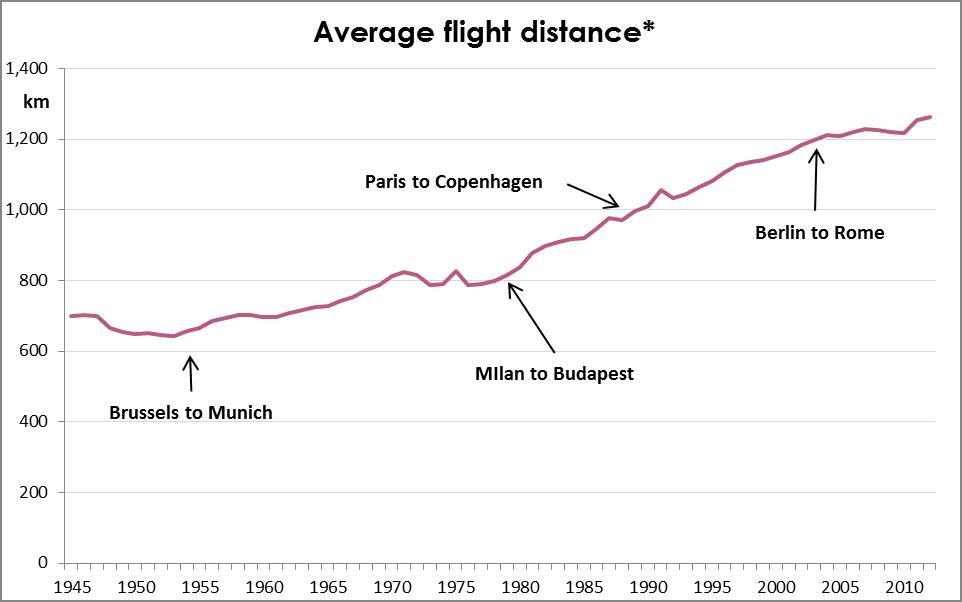
In 2014, 52 million people boarded domestic flights in Australia¹. That’s 2.2 flights per capita (or 1 return trip per person). Much like the growth seen in International flights, domestic flights have been increasing at almost exponential rates since 1945.

Domestic Passengers per capita

Domestic flights have become such commonplace that the Sydney to Melbourne route (and back) ranks in the top 5 busiest routes in the world²³!

Perhaps even more surprising is that the Melbourne – Launceston route (Australia’s 17th most popular in 2014) was busier than every route in England. In fact, there were only 6 European countries in 2014 (France, Spain, Norway, Germany, Italy and Sweden) with a busier domestic route than Melbourne to Launceston4.

Overall, there are twice as many plane passengers in Australia per capita than the OECD average, when comparing all fights (domestic and international).

Flights by country 2

When it comes to environmental impact, flights ain’t flights. The routes included in BITRE “Top routes” list range from 236km (Sydney to Canberra) to 3,615km (Brisbane to Perth). Since 1945, the average distance travelled per passenger per trip has increased steadily to 1,200km (roughly Sydney to Adelaide, or Perth to Karratha). So, not only are Australians travelling more, but they are also travelling further.

Flight Distance 3

* Weighted average, by number of passengers.

This means the overall impact is starting to sound like a Daft Punk song…

Longer, faster, more often…

Or in CO2 terms… more, more, more.

CO2 emmissions per capita

In 2015 Australians will emit more CO2 in domestic flights alone, than the people from the bottom 42 countries emit in total, (roughly 500kg).5

I suppose this is the price of aviophobia  therapy.

_____________________________________________

p.s.: For those wondering, the sharp dip in 1989 is due to the Pilot’s strike:  https://en.wikipedia.org/wiki/1989_Australian_pilots%27_dispute

_____________________________________________

[1] Bureau of Infrastructure, Transport and Regional Economics (BITRE) https://bitre.gov.au/publications/ongoing/domestic_airline_activity-annual_publications.aspx

[2] http://www.economist.com/blogs/graphicdetail/2012/05/daily-chart-8

[3] https://en.wikipedia.org/wiki/World%27s_busiest_passenger_air_routes

[4] Not including Russia, as their figures were not found.

[5] http://data.worldbank.org/indicator/EN.ATM.CO2E.PC

Wealthy fare well from welfare

Wealthy fare well from welfare

In 2013-14, the Australian Government dispersed a Robin Hoodesque $105 billion across the community through income support payments. That’s roughly 30% of its tax revenue. Unlike Robin, however, Kevin, Julia, Tony and their merry men gave much of their loot to the most fortunate, rather than to the poor.

Based on research conducted by the Australian Productivity Commission[1], the wealthiest half of households received just as much income support as the poorest half.  And whilst the poorest decile (10%) received the most support, those in middle upper wealth households (50th to 80th percentile) received the lion’s share.

The distribution of government support to wealthy households is largely driven by Aged and Family pensions, whilst Unemployment, Study and Disability payments go some way to balancing out the situation.

Newstart allowance (a.k.a. the dole) and Study Support programs are tightly targeted based on income and wealth of the recipient. Disability payments are also largely provided to less wealthy households. This leads to claims that the Australian Welfare system is one of the most targeted in the world.

Income Support - Dole and Study

However these two payments only make up 7% of all income support provided by the government.

The majority of the loot is given away in the form of Aged Pensions (44%) and Family Payments (26%).

Income support by payment

Unlike the dole, Aged Pensions and Family Payments are much looser in their targeting.  As a result, more of these benefits are paid to the top wealth brackets than to the poorer households.

Income Support - Pensions

Unfortunately, this appear to create an entirely misguided system in which the wealthiest households in Australia receive more welfare than those with limited resources, to the extent that the amount paid in Aged Pensions to the top 20% of households is $1.2 billion more than the entire unemployment benefits.


This is not to suggest that pension need cutting, nor that the Australian welfare system is over-inflated.

Rather that we’re failing to funnel funds to support those in the greatest need.

____________________________________________

[1] Productivity Commission – Tax and Transfer Research

[2] Image credit: hktang – Flickr – / CC BY – Modified

The roads know no date

The roads know no date

By the time the Christmas Holiday Road Toll counter begins, the worst is all but over. For many, unfortunately, the reminders of the roads’ dangers come too late.

Every year the Australian media and Police and Roads Departments produce an hour by hour, day by day counter of the road fatalities occurring during the festive season. News bulletins focus on yet another untimely death, and end of year best wishes are accompanied by a “stay safe on the roads” message.

It has almost become a new Hallmark theme, alongside “It’s a boy”, “Get Well soon”, and “I might not want to personally join such an outdated and discriminative institution, but I respect your right to do so, even if many aren’t yet afforded that right”¹.

Whilst road fatalities are a serious issue deserving of media attention, the Christmas period is not news worthy. In fact, the focus might incorrectly imply that the rest of the year is less dangerous, and therefore less deserving of our vigilance.

Road Toll Graph

Based on figures from 1989-2014 from the Bureau of Infrastructure, Transport and Regional Economics’ (BITRE), the Xmas Toll period (which this year runs from the 23rd December to the 3rd January) has a lower road fatality average than the rest of the year².

The graph above compares each day in December through to mid-January to the average death rate for the entire year. These figures are based on data in the 1989-2014 period, for which the average is 4.7 road fatalities per day.  The red areas denote a day where there are more deaths on the road than average, and grey areas denote smaller number of casualties.

Other than a small spike on Boxing and New Year’s Day, the rest of the Xmas Road Toll Period is remarkably below average.

Unlike the Festive period, the weeks just prior to it do seem more dangerous than average. On average, 110 people will die on the roads in the first 3 weeks of December every year. This is more than in any other 3 week continuous period during the year.

Newspapers are not entirely unaware of the numbers. In fact they usually publish an article or two every year showing how misleading these tolls are (example ³). Yet they continue to misguide the community and create panic by perpetuating the myth.

The question is how we focus our educational and advertising campaigns to have the greatest impact.  I doubt Christmas is the answer. It rarely is.

__________________________

[1] This comment is source-less, and potentially misleading.
[2] http://bitre.gov.au/statistics/safety/fatal_road_crash_database.aspx

[3] http://www.theage.com.au/victoria/victorians-need-to-stop-talking-about-the-road-toll-tac-chief-says-20151223-glu3c8.html


Re-calibrating medical sex

Re-calibrating medical sex

Thirty years ago TVs were filled with MacGyver, dancefloors swayed to Cindy Lauper, the US threw its weight all over Latin America, and 8 out of 9 visits to Australian Doctors were seen by guys.

Australians made 68.1 million visits to General Practitioners in 1984-85, and 60.6 million of those services were provided by male doctors[1].

Since then the GP sexual landscape has been changing at a steady pace.

University data show increasing number of women graduating, doing so in larger number than men since about 1987[2], and these graduates have had a visible impact on the professional make-up.

Whilst we haven’t scaled the heights of Cindy nor MacGyver, and the US is still largely using its army to secure market-share around the globe, our medical gender balance has drastically improved.

By 2013-14 women provided 33% of all GP services. That’s triple the 11% provided in 1984-85.

Like many other professions, women work part-time at higher rates than men. Women GP work the equivalent of half a full-time role on average, while male doctors work two-thirds of a full-time role. This means that even though only 33% of GP services are provided by women, they make up 43% of all working GPs. This is almost double the 22 % they made up in 1984-85.

Count of GPs by Sex

This means that of the 15,742 more GPs Australia has now in comparison to the mid-80s, 10,228 of them (or 65%) are women!

Unfortunately the Health Department figures are not provided by gender and age. However, based on the rapid change in gender balance, the increasing rates of female graduates, and the growing number of doctors nearing retirement age, I suspect the overall balance will continue to calibrate in the coming decade.

Is this enough? Hells no. But it might provide more role-models, and perhaps even help the gender pay-gap which has stubbornly continued despite improvements across various socio-economic areas.

_______________________________________________[1] http://www.health.gov.au/internet/main/publishing.nsf/content/general+practice+statistics-1

[2] http://docs.education.gov.au/system/files/doc/other/time_series_data_1949_-_2000.pdf