Goats on our roads
Seems the latest food fashion in Australian politics is Goat a la scāpé. And it’s being served at both parties.
Politicians are spruiking lowering migration, or at the very least defuse it from the big cities, as it seems foreigners are clogging up our roads. (At least they stopped stealing our sheep!)
The claim seems to follow a simple rationale:
1. Cities (e.g. Melbourne and Sydney) are getting bigger
2. The increase is mostly driven by overseas migration
3. This is putting more people on the roads
4. Hence increased traffic congestion (and insinuations of other social ills)
In short, migrants = traffic congestion. A simple, winning argument.
Except, I’m not convinced it’s true.
Points 1 and 2 are fine. Overseas migration is the largest component of population growth in Australia, particularly our largest cities. Point 3, on the other hand, seems flawed in two ways:
a. The driver: increased congestion could be caused by centralisation of workforce, and
b. Diversity: not all people are equal (in how they travel to work).
While they may appear minor oversights at first, these flaws are so fundamental that migrants may not only be a non-issue, but in fact part of the solution.
Are we jumping to conclusions?
But before we begin,  is it worth questioning the conclusion in the first place? How much worse is congestion getting in our big cities? According to the Grattan Institute “the length and time of commutes barely changed in Australia’s biggest cities during the exceptionally rapid population growth between 2011 and 2016. In Sydney, Melbourne, Brisbane and Perth, commute distances in 2016 were almost indistinguishable from 2011″¹.
Let’s focus on Melbourne city to examine this further.
The number of people who work in Melbourne city grew 21% in the period 2011 to 2016, from 347k to 422k². That’s way faster than Melbourne’s overall population increase of 13% in the same period. The increase in CBD jobs may also be driven by the changing make up by industry, i.e. the increase in professional, hospitality, and finance jobs which tend to be more centralised. So, it’s likely there would be more people working in the CBD even without the new migrants.
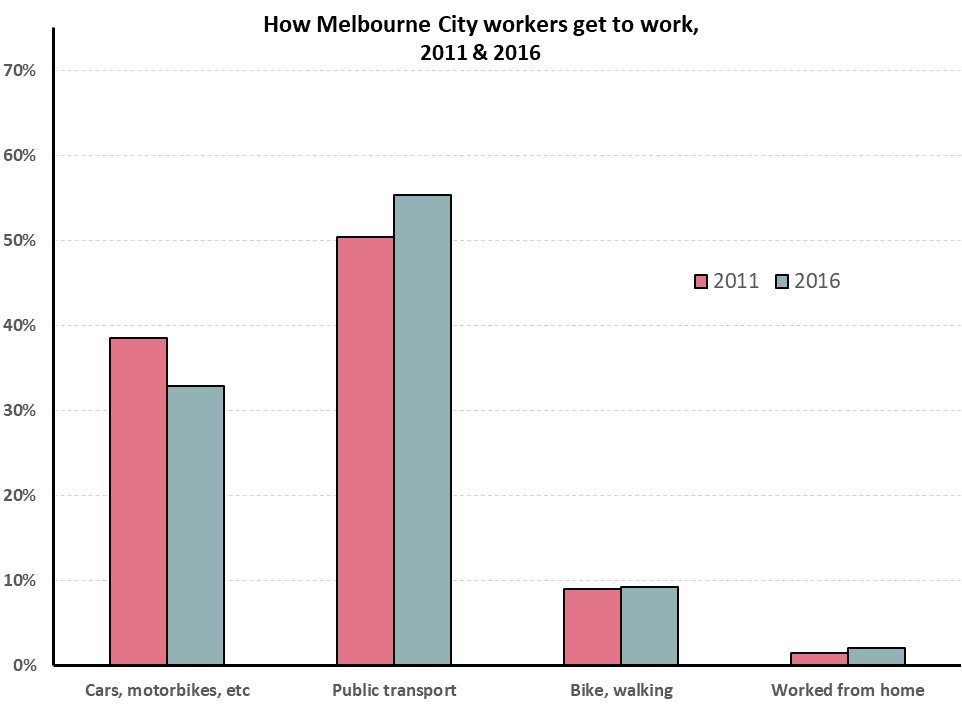
Yet, even though the number of city workers has increased by 75,000, there’s only 4,000 more people driving into town in 2016 than there were in 2011. That’s because the way in which people travel to work has changed. A smaller percentage drive, and a greater percentage catch public transport, walk/ride or work from home.

This change seems to be led by recent migrants. City workers who are long term Melbourne residents (i.e. have lived within the Melbourne Metropolitan area for at least 5 years) are 2.5 times more likely to drive to work than recent migrants. While recent migrants are almost 2.5 times more likely to walk or ride to work. Workers who moved to Melbourne from elsewhere in Australia (including country Victoria or interstate), fall somewhere in between.

If the percentage of people driving into town had not changed since 2011, Melbourne would have had an extra 14,000 cars on the road in 2016, not the 4,000 increase which occurred.
This of course is also overly simplifying. Congestion would also have changed the choices of the long-term Melbourne residents if they needed to take on city jobs. But I doubt it would have changed them enough as to resemble the choices of recent migrants. This would include large social changes, an increased acceptance of inner-city apartment living, and waving goodbye to the American Australian home-owning dream.
Similarly, Melbourne could move away from its current thriving tech, financial, educational and hospitality industries which centralise the workforce in town. Specially as without the recent migrants Melbourne would struggle to fill those jobs, as the skills may not be available locally.
But in the current world, the fact that such a large percentage of city workers are recent migrants seems to be the main reasons our roads are not at a stand-still.
Sources:
- Terrill, Marion, Batrouney, Hugh, Ha, James, and Hourani,Diana (2018). Remarkably adaptive: Australian cities in a time of growth. Grattan Institute.
- All travel to work data sourced form the Australian Bureau of Statistics, Census 2011 and 2016.

